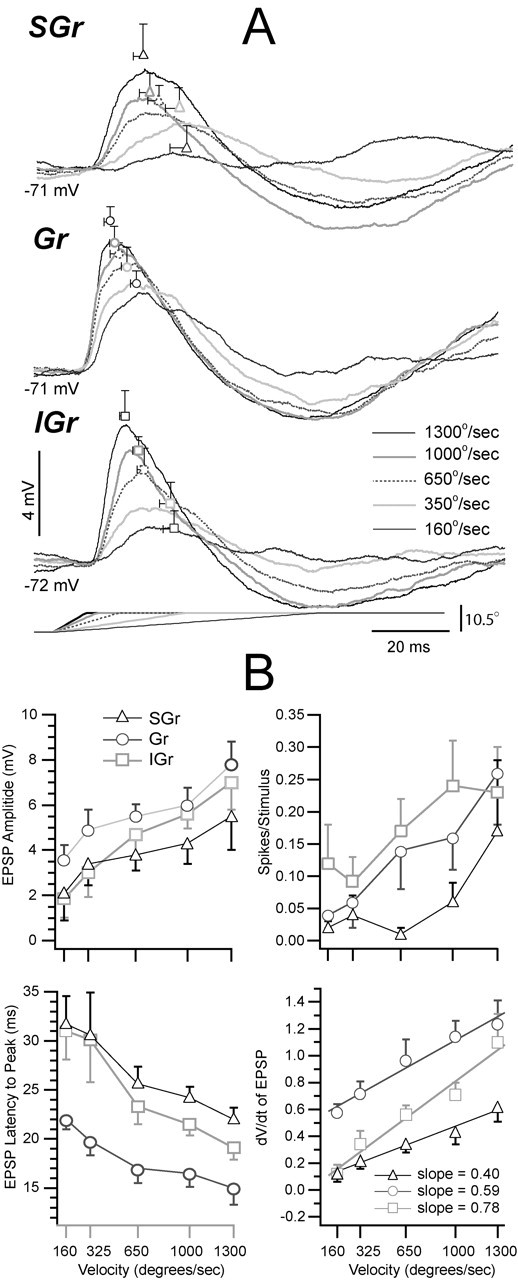
Figure 7.

Responses of each population as a function of stimulus intensity (velocity-acceleration). A, Population synaptic responses at the resting Vm to the five velocity-acceleration values. The values of the mean ± SE of the latency to peak and the peak amplitude are shown superimposed on the population averages in A at their corresponding x- and y-axis coordinates. B, Scatter plots are the means ± SE of the parameters indicated in the ordinates, calculated using the measurements obtained from the individual cells in each group. Values are plotted against deflection velocity (and not acceleration; see Materials and Methods). Same symbols as in Figure 2.
