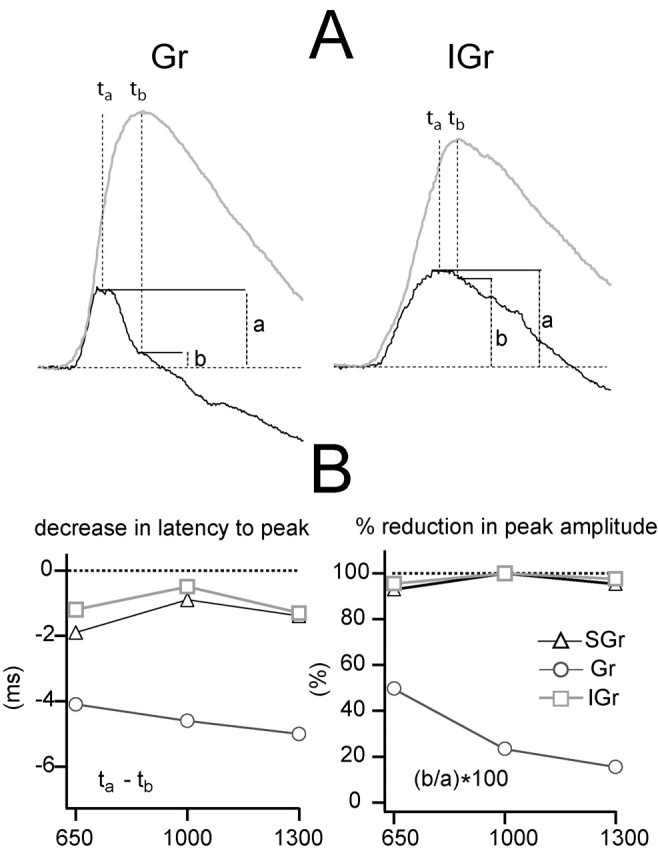
Figure 9.

The effect of Vm on the shape of the population synaptic response. A, Population synaptic responses of Gr (left) and IGr (right) to the highest deflection velocity-acceleration at the depolarized and hyperpolarized Vms are shown in Figure 8 to illustrate where the measurements in the plots below were made. The dark trace is the response under depolarizing current, and the light trace is the response under hyperpolarization. SGr is not represented for simplicity. Letters indicate peak time of the depolarized response (ta), peak time of the hyperpolarized response (tb), peak amplitude of the depolarized response (a), and amplitude of the depolarized response at the time of occurrence of the peak of the hyperpolarized response (measured by tb). B, Decrease in peak latency (left plot; ta - tb) caused by depolarization for the three highest deflection velocity-acceleration values. Reduction in peak amplitude (right plot), expressed as a percentage of amplitude of the peak of depolarized response (b/a · 100) is shown. Symbols represent the three population synaptic responses.
