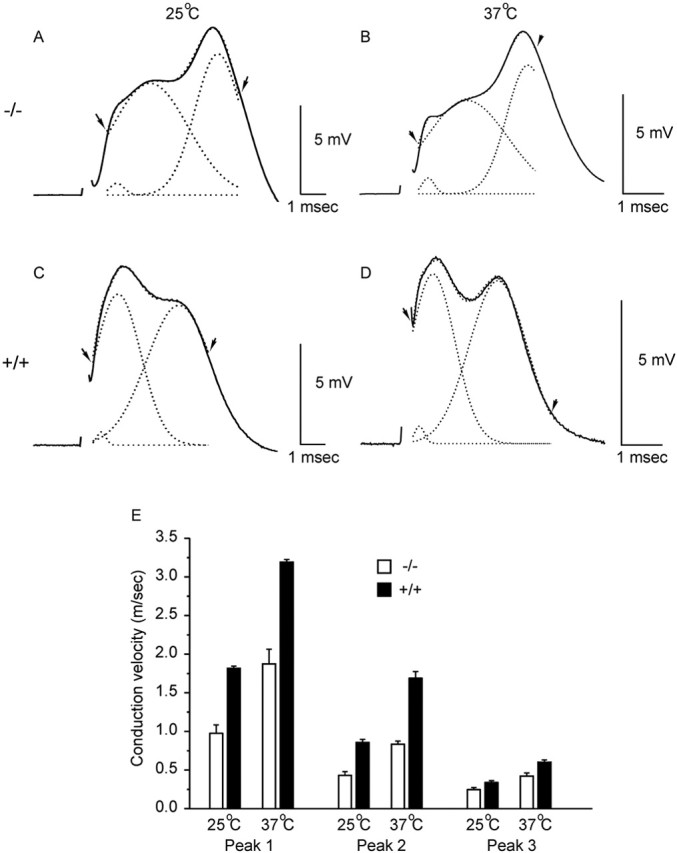
Figure 6.

Conduction velocities in the optic nerve. A-D show CAPs at P15-P17 from β1 (-/-) mice (A, B) and β1 (+/+) littermates (C, D). Records were taken at room temperature (A,C; 25 ±1 °C) and at 37 °C (B, D). The solid lines illustrate the original sweeps. CAPs were fitted to the sum of three Gaussian curves between the arrows, and the fit is superimposed (dotted line just discernable). Also shown are the three individual curves (dotted lines) from which times to peak were measured. E, Bar graph showing conduction velocities for each component (mean ± SEM). Differences between β1 (-/-) (open bars) and β1 (+/+) (filled bars) were significant for peaks 1 and 2 (p ≤ 0.005 at both temperatures) and borderline for peak 3 (p = 0.04 at 25°C).
