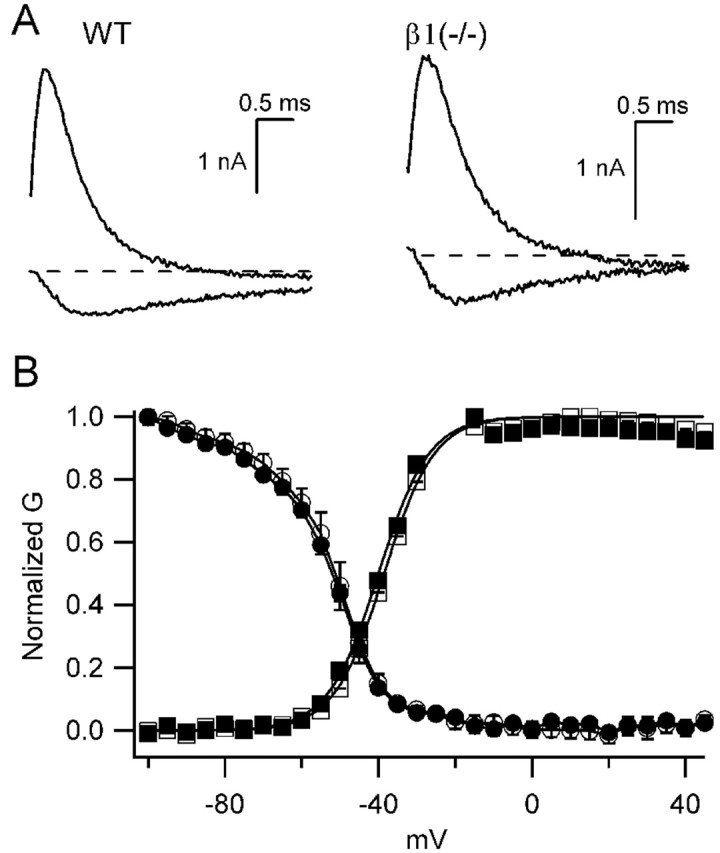
Figure 9.

Voltage-dependent properties of β1 (+/+) and β1 (-/-) mice. A, Sodium current traces in response to depolarizations to -30 mV (inward current) or +20 mV (outward current) from a holding potential of -80 mV from β1 (+/+) (left) or β1 (-/-) (right) mice. B, Mean normalized conductance-voltage curves (squares) and inactivation curves (circles) for wild-type (WT; open symbols) and β1 (-/-) (filled symbols) mice. To generate conductance-voltage relationships, 20 msec depolarizations from a holding potential of -80 mV to the indicated potentials were applied. Peak current versus voltage curves were measured and fit with[(V - Vrev) × Gmax]/{1 + exp[(V - V.5)/k]}, where V was the test pulse voltage, Vrev, the reversal potential, V.5 the half activation voltage, and k a slope factor. Normalized conductance-voltage curves for each experiment were determined as 1/{1 + exp[(V - V.5)/k]}, and the means ± SEM of these curves are plotted. Inactivation curves were measured using a 20 msec long prepulse to the indicated potentials, followed by a test depolarization to +10 mV. Mean normalized peak test pulse current is plotted versus prepulse potential.
