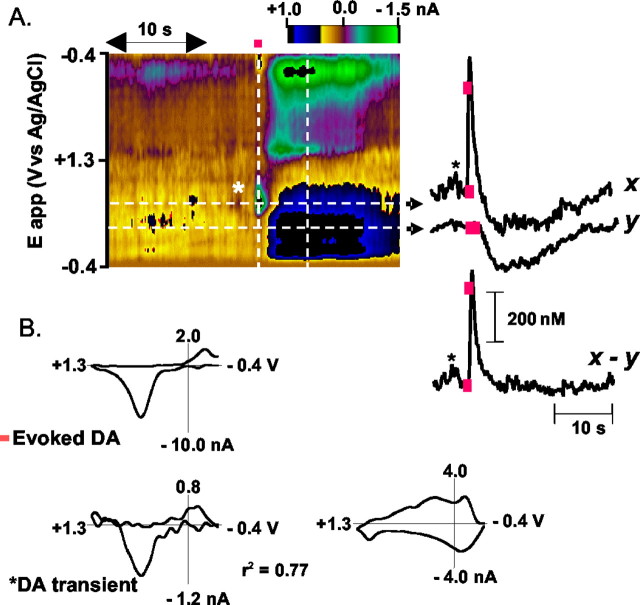
Figure 1.
Spontaneous and electrically evoked dopamine release in the NAc monitored by cyclic voltammetry. A, The voltammetric current (encoded in color) is plotted against the applied potential (ordinate) and the acquisition time (abscissa). During electrical stimulation of the MFB (biphasic pulses, 0.4 sec duration, 60 Hz, ±120 μA; red bar), dopamine rapidly increased (green spot shows oxidative current). The dark blue area after the green spot is caused by a nondopaminergic (ionic) change. The time courses of the signals observed at different applied potentials (indicated by the dashed white lines) are shown to the right of the color plot: x, current at the peak oxidation potential (0.62 V) for dopamine; y, current at 0.21 V, a potential insufficient to oxidize dopamine but centered on the ionic change. Subtraction of y from x yields a signal that is attributable to dopamine changes; red boxes are times at which electrical stimulation began and ended; asterisk identifies the dopamine transient. B, Cyclic voltammograms extracted from this data set: Evoked DA, the cyclic voltammogram recorded at the end of the stimulation; DA transient, the cyclic voltammogram recorded at the time indicated by the asterisk on the color plot; r2, the correlation coefficient for the comparison of the two voltammograms. The cyclic voltammogram characteristic of the ionic change (at the time of the second vertical dashed bar on the color plot) is shown to the right.

