
Figure 2.
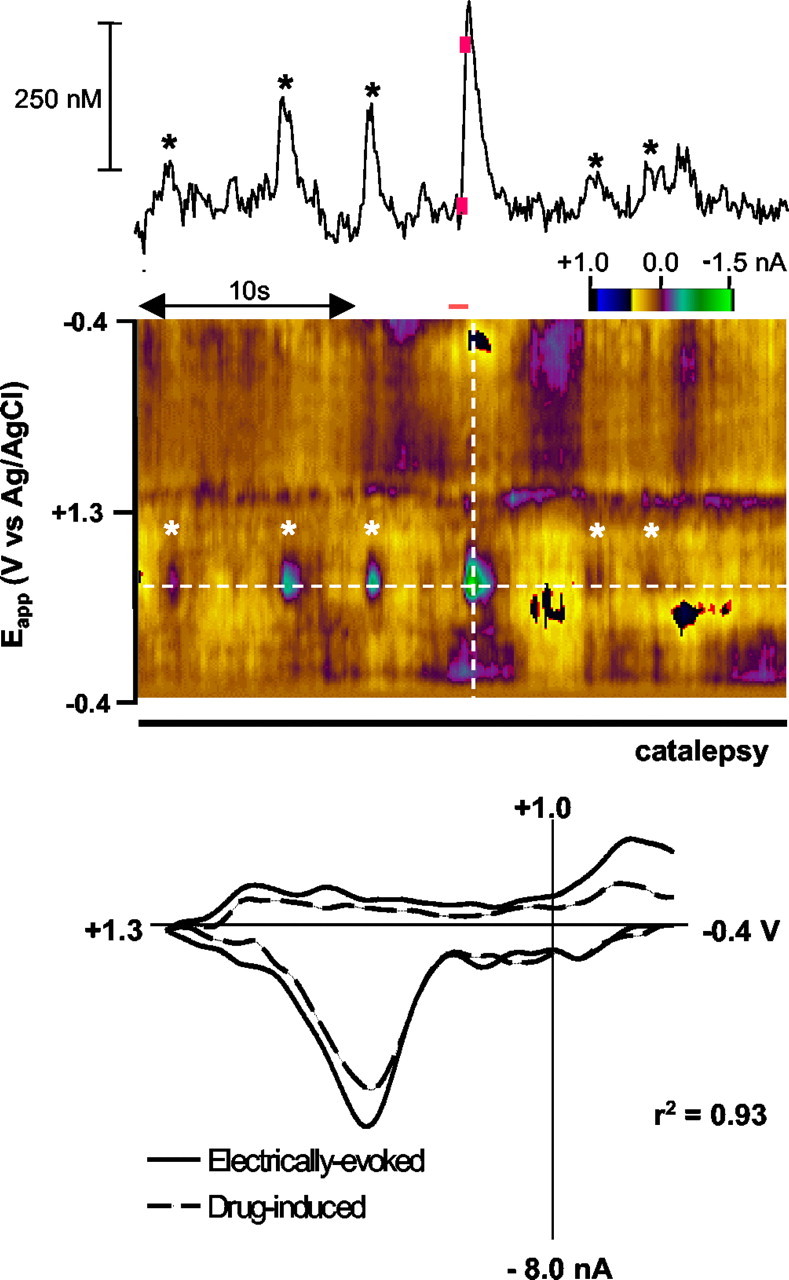
WIN55,212–2 increases the number of dopamine concentration transients in the NAc. Cyclic voltammograms recorded in the same animal and location as in Figure 1 after administration of WIN (125 μg/kg). The trace above the color plot is the current at the potential where dopamine is oxidized, corrected for ionic changes. Asterisks indicate times at which cyclic voltammograms reveal an increase in dopamine concentration. Electrical stimulation of the MFB (biphasic pulses, 0.4 sec duration, 60 Hz, ±120 μA) occurred at the time indicated by the red bar. The cyclic voltammogram corresponding to stimulated release (red bar) in the bottom panel (solid line) exhibits a correlation coefficient of 0.93 when superimposed on the WIN-induced transient (dashed line) occurring immediately before it.