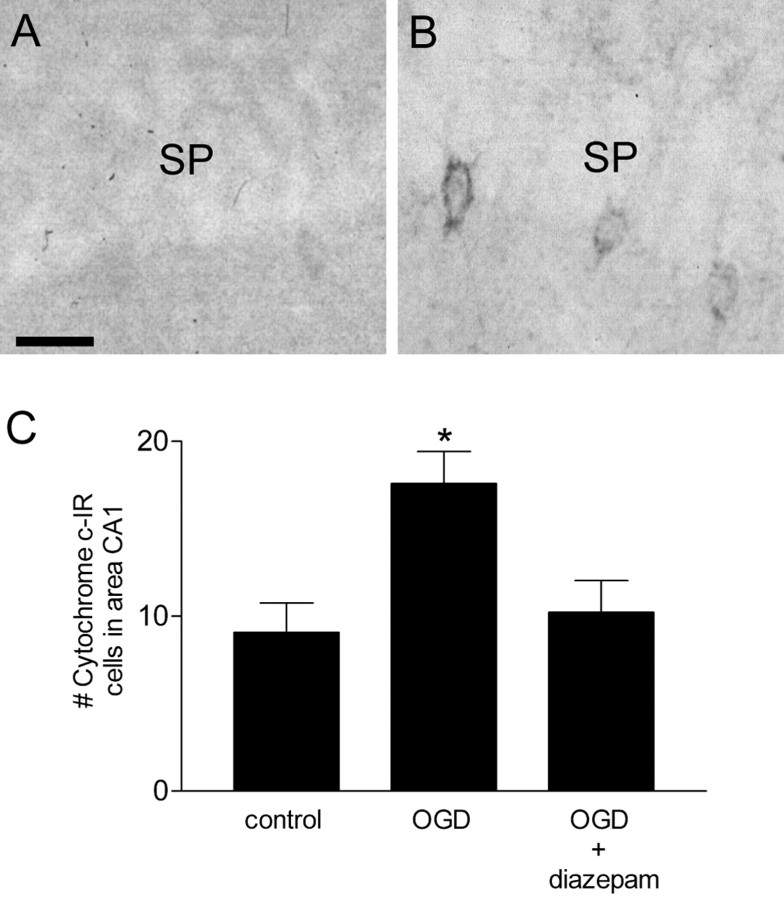
Figure 2.
Cytochrome c immunostaining in hippocampal area CA1 2 hr after reoxygenation. Sections (30 μm) were prepared from hippocampal slices and subjected to cytochrome c immunohistochemistry as described in Materials and Methods. A, Control slice. B, Slice subjected to OGD. SP, Stratum pyramidale. C, Quantitiation of immunopositive cells in area CA1 of the hippocampus 2 hr after OGD. Diazepam (5 μm) was added immediately after OGD. Data are the means ± SEM number of immunopositive cells counted in area CA1. *p < 0.01 versus control; ANOVA, followed by Tukey's multiple comparison test (n = 6–10 slices). Scale bar, 25 μm.

