Figure 4.
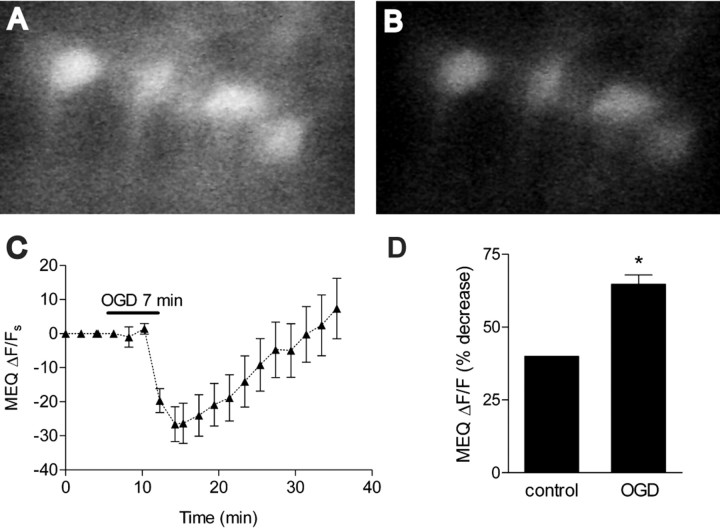
Effect of OGD on MEQ fluorescence (intracellular Cl–) in are a CA1b pyramidal cells. A, B, Confocal video images of MEQ fluorescence in adult hippocampal neurons in area CA1b stratum pyramidale. Special conditions were required to bath-load adult slices successfully with dihydro-MEQ (see Materials and Methods). MEQ fluorescence before (A) and after (B) OGD, at the onset of reoxygenation. C, Continuous recording of the change in MEQ fluorescence within individual CA1 pyramidal neurons before, during, and immediately after OGD. The temperature was maintained at 36°C. The bar indicates the 7 min OGD period. The original ΔF/F values were corrected for baseline by subtracting extrapolated values from the baseline drift of each cell (before OGD) to give the ΔF/F values. D, The peak change in MEQ fluorescence 10 min after the onset of OGD was compared with the fluorescence change in control slices not subjected to OGD over a 10 min recording period. Values are expressed as the percentage decrease in fluorescence during 10 min from the baseline [(ΔF/F) × 100]. Data are the means ± SEM of three to seven cells per condition, respectively. *p < 0.01 versus control; unpaired Student's t test.

