
Figure 1.
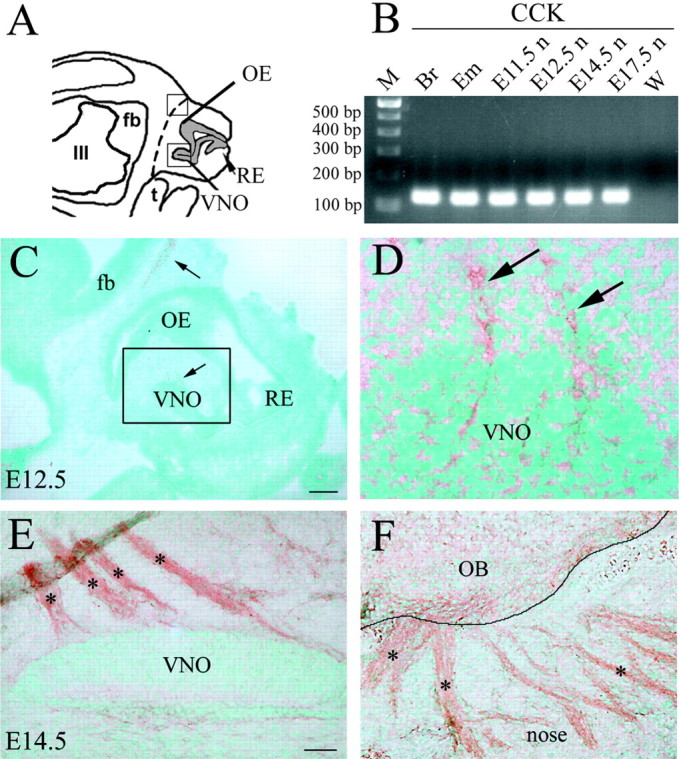
Olfactory system expresses CCK during embryonic development. A, Schematic of an E12.5 head; forebrain (fb), olfactory epithelium (OE), presumptive vomeronasal organ (VNO), respiratory epithelium (RE), tongue (t), and third ventricle (III) are depicted. Dashed line indicates boundary between nose and brain and represents region taken for nasal RNA isolation in B. B, Gel documentation of products produced by RT-PCR amplification using nested CCK primers. Total RNA was isolated from nose (E11.5n–E17.5n). Adult brain (Br) and E17.5 whole embryo (Em) were used as positive control tissues. A band of expected size (169 bp) was detected in positive control tissues after first-round PCR (data not shown). Second-round PCR, using 1 μl of first-round amplicons and second set of nested primers, yielded the predicted 135 bp product in all samples but water [w; a DNA ladder of 100 bp markers (m) was loaded in left lane]. C, Sagittal section of an E12.5 mouse embryo (16 μm) immunostained for CCK. CCK-immunopositive tracks extended from the presumptive VNO (D, see boxed area and high magnification), and a light signal was detected at the boundaries between the nasal region and the forebrain (nasal–forebrain junction; arrow). E, F, Immunohistochemistry for CCK on a sagittal section of an E14.5 embryo. At this stage, a notable increase in CCK immunoreactivity was evident throughout the axon bundles emerging from the VNO (E, asterisks) and the olfactory axons reaching the nasal–forebrain junction (F, asterisks). OB, Olfactory bulb. Scale bars: C, 150 μm; D, 15 μm; E, F, 50 μm.