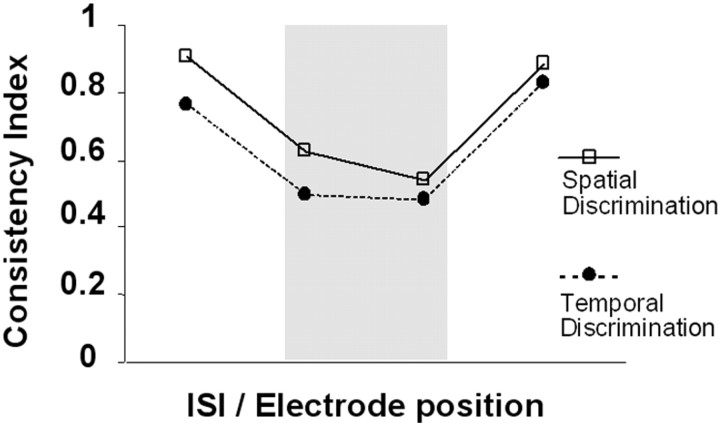
Figure 2.
Grand mean of the consistency index for the 14 subjects, showing the behavioral performance during fMRI for SD (open squares, continuous line) and TD (filled circles, dotted line). On the x-axis are different ISI-electrode configurations, with short ISI (TD task) and leftward electrodes (SD task) plotted on the left of this graph (note that the exact ISI values and electrode position will vary for each subject, because these were determined individually). As expected, responses to electrode positions-intervals in the penumbra (gray shading) were less consistent than responses to limit-range conditions. Behaviorally, there was no significant effect of task or interaction between task and consistency.

