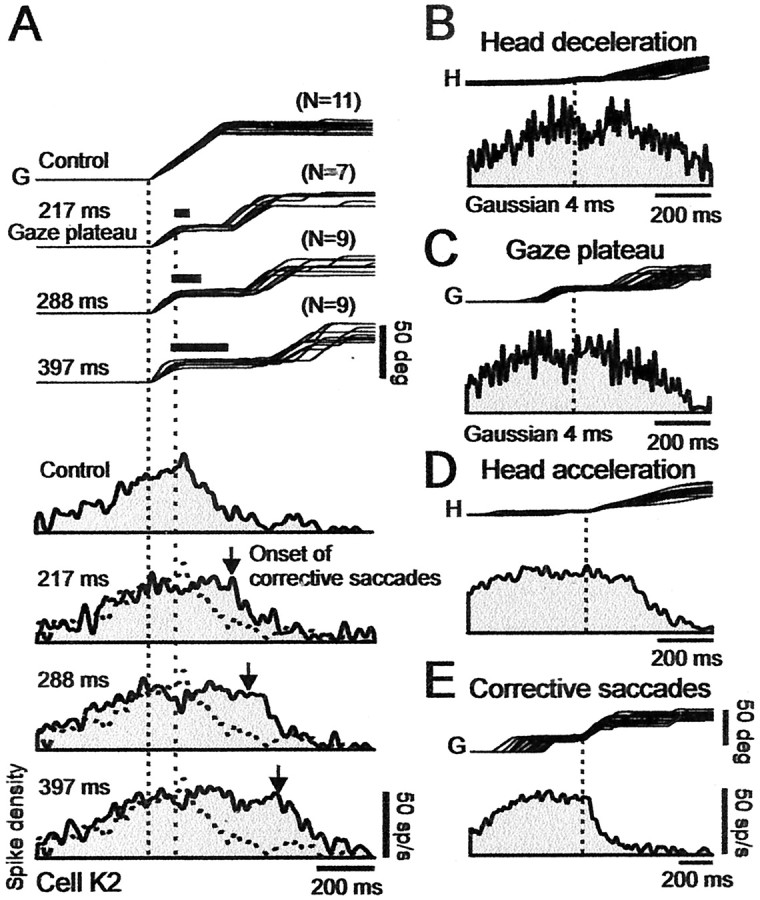
Figure 3.

Effect of perturbing head (and therefore gaze) trajectories on discharges of cell K2 in caudal SC at 48° location. A, Gaze (G) traces show, from top to bottom, control and three selected brake conditions with mean gaze plateau durations of 217, 288, and 397 msec, respectively. Trials were also selected such that plateaus are about at a fixed position relative to the target, at GPE = 25 ± 5°. Number of superimposed trials in each condition is indicated at top right of each group of traces. The spike density histograms that correspond to each condition are shown sequentially below the gaze traces. All of the traces aligned on gaze onset (left vertical dotted line). Right vertical dotted line indicates start of brake-induced plateaus. Thick bars over plateaus indicate average duration of brake. Vertical down arrow in each spike density histogram indicates average time of onset of corrective gaze saccades. Note that firing frequency remained about constant during gaze plateau, and discharge duration increased with plateau duration. B, Effect of head brake on activity. Top trace shows the superimposed head (H) trajectories for all 35 brake trials in A, aligned on onset of head deceleration. Bottom trace shows associated weak transient depression in the average spike density histogram. C, Effect of head brake on activity during gaze plateau. Transient depression was over at start of plateau. D, Effect of head acceleration. Same as in B but with head traces now aligned on onset of head acceleration after brake release. Activity was not directly affected by head acceleration. E, Activity linked to corrective gaze saccades. Traces aligned on onset of corrective gaze saccades. Note the absence of saccade-related bursts, and that, during corrective saccades, activity decreased monotonically to near zero at gaze end. Spike density histograms were obtained using 10 msec (A, D, E) and 4 msec (B, C) Gaussian filters.
