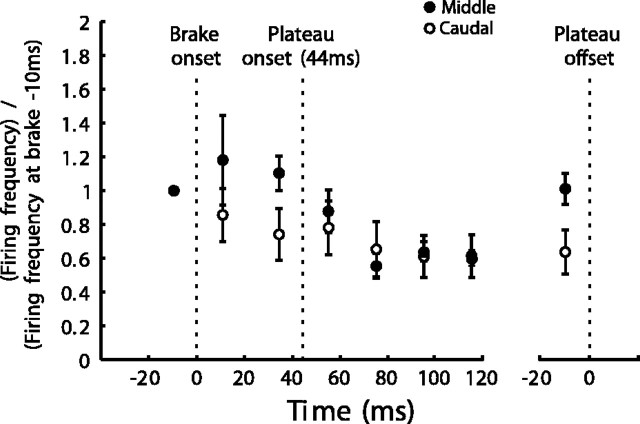
Figure 7.
Evolution with time of postbrake mean activity for two populations of cells in the caudal and middle SC, respectively. Caudal cells (open circles), Mean of the mean discharge of each of cells K2, K5, K9, K9a, and K2a. Same for middle cells (dark circles): K7, K10, W112d, and W110. Activity levels for both populations normalized to the mean value in the 20 msec period before brake onset. Mean time between brake and plateau onsets was 44.5 msec. The activity levels in the 20 msec period before plateau end are shown to far right. Short vertical lines through each point indicate SE. Note that, for both populations, the activity levels at the start and end of plateaus were equal despite a transient decrease during the plateau. See Activity during Brake-Induced Gaze Plateaus for details.

