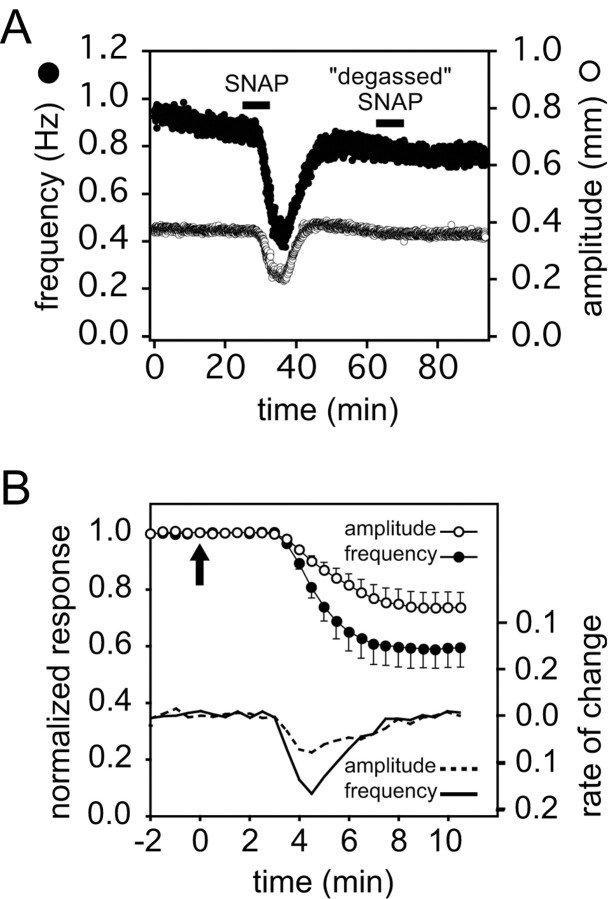
Figure 3.
Time course of the effects of SNAP on the isolated, spontaneously beating heart. A, Amplitude (white symbols) and instantaneous contraction frequency (black symbols) from a representative experiment plotted as a function of time before, during (black bar), and after washout of 10–5 m SNAP, followed by the application of 10–5 m SNAP solution that had been allowed to decay for more than eight half-lives (degassed SNAP). B, The initial phase of the response to 10–5 m SNAP (applied at the arrow) as a function of time (data represent means ± SE of 9 preparations). To combine data from different preparations, we scaled the control amplitude and frequency to 1 for each experiment and normalized subsequent heartbeats relative to control. Data were subdivided into consecutive 30 sec time bins, and the mean amplitude and frequency were determined in each bin (moving bin analysis). The average of these means (and the SE) were then calculated for each time bin across the nine experiments. After an initial lag (attributable in large part to the dead space in the perfusion line) the amplitude and frequency decrease in parallel. The rates of change of each parameter with respect to time are given by the solid and dashed lines, respectively.

