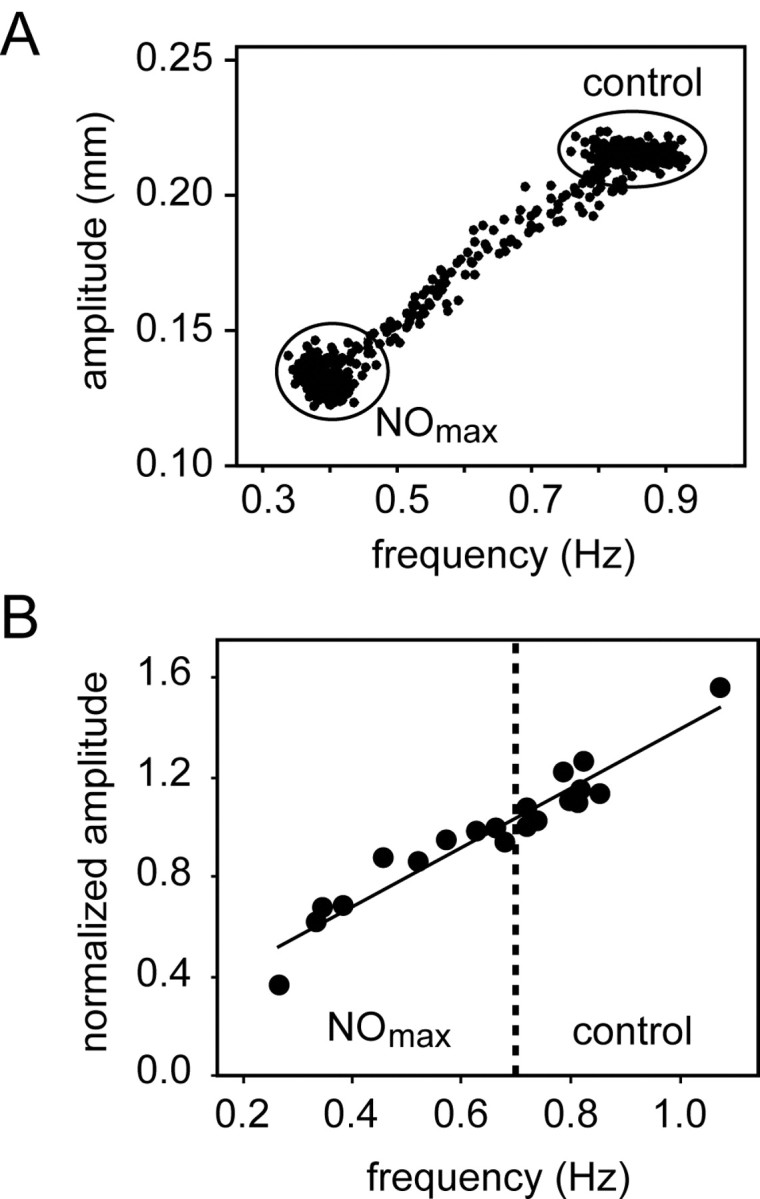
Figure 4.

The frequency and amplitude of the heartbeat are linearly correlated over a range of frequencies. A, Data from a single preparation before and during its response to 10–5 m SNAP, with the amplitude of each heartbeat plotted as a function of the instantaneous frequency of that beat. (See Results for details.) B, Amplitude versus frequency data from nine preparations. Contraction amplitudes were first normalized to 1 at 0.7 Hz contraction frequency for each preparation. Mean normalized control amplitudes (all at frequencies >0.7 Hz) and mean normalized amplitudes at the peak of the SNAP response (all at frequencies <0.7 Hz) were plotted against the respective mean contraction frequencies in the absence (control) and presence (NOmax) of SNAP. The solid line represents a linear regression fit (r2 = 0.92; p < 0.001).
