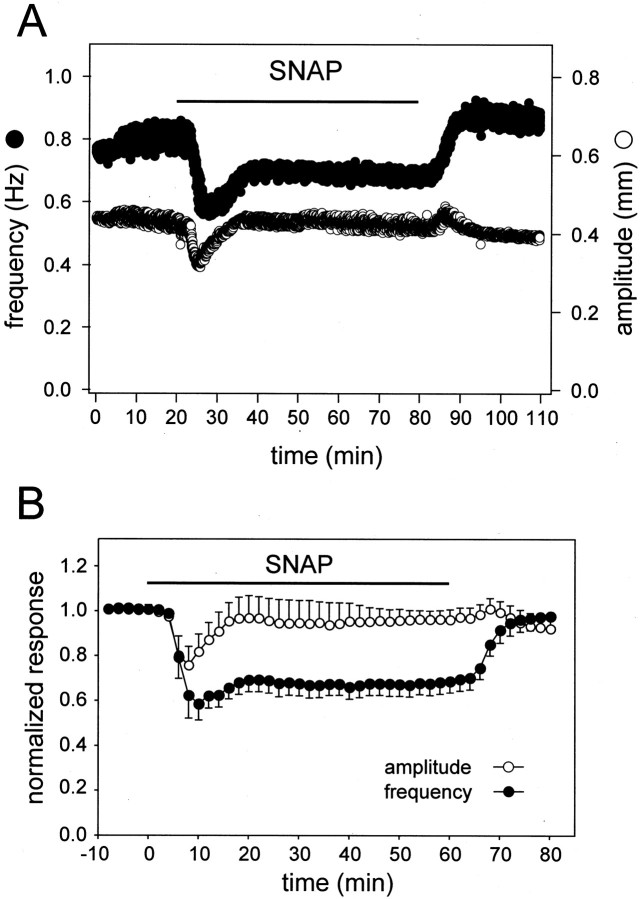
Figure 5.
Nonequivalent adaptation of amplitude and frequency during prolonged exposure to SNAP. A, Time course of changes in heartbeat amplitude (white symbols) and instantaneous frequency (black symbols) of an individual preparation before, during (black bar), and after a 60 min exposure to 10–5 m SNAP. B, Averaged data from six such experiments, normalized as in Figure 3B with 2 min time bins.

