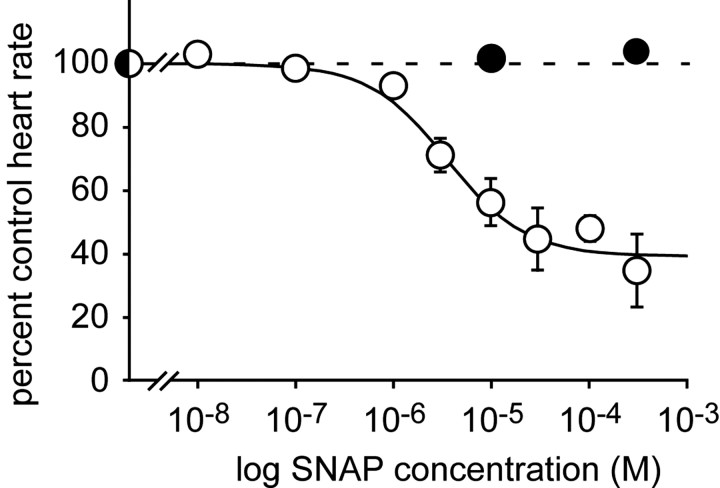
Figure 6.
The effects of SNAP are concentration dependent. Heart rate plotted as a function of SNAP concentration (white symbols; n = 8 animals), or degassed SNAP (black symbols; n = 3). Each point represents the mean ± SE response to a 15 min application. Data were fitted to a standard single binding site isotherm with an IC50 of 5 × 10⁻⁶ m.

