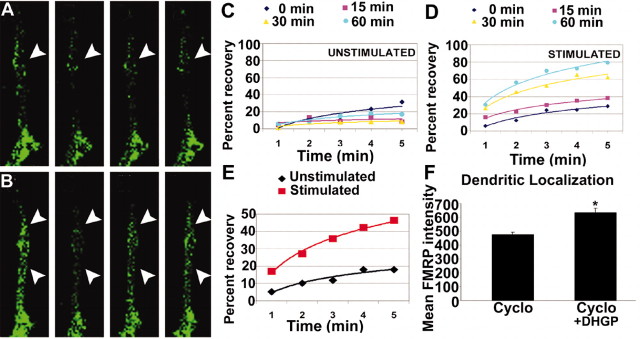
Figure 3.
A–E, FRAP analysis of increased EGFP–FMRP granule trafficking in response to KCl stimulation. Hippocampal neurons were transfected with EGFP–FMRP and imaged with either no added stimulus(A, C) or 20 mm KCl (B, D). The recovery of each photobleached region was followed for 5 min at 1 min intervals. A, The first panel (from left) shows the EGFP–FMRP signal in an unstimulated neurite before photobleach, and the second panel shows immediately after photobleach. Subsequent panels show signal at 3 min (3rd panel) and 5 min (4th panel) after photobleach. Arrowheads (A, B) point to regions that exemplify the reduced recovery of EGFP–FMRP granules in the absence of stimulation (A) compared with those in the same cell treated with 20 mm KCl (B). Quantitative analysis of recovery of the EGFP–FMRP signal in this cell is shown at three time points (15, 30, 60 min) after perfusion with normal media as a control (C) or media with KCl (D) treatment. A summary of all FRAP analyses (E) compares the percentage recovery of EGFP–FMRP in neurites of several cells measured for each treatment within 1 hr of stimulation or mock treatment. F, Dendritic localization of FMRP was not protein synthesis dependent. Bath application of cycloheximide for 30 min to cultured neurons before stimulation (5 min DHPG) did not affect mGluR-dependent FMRP localization.

