
Figure 1.
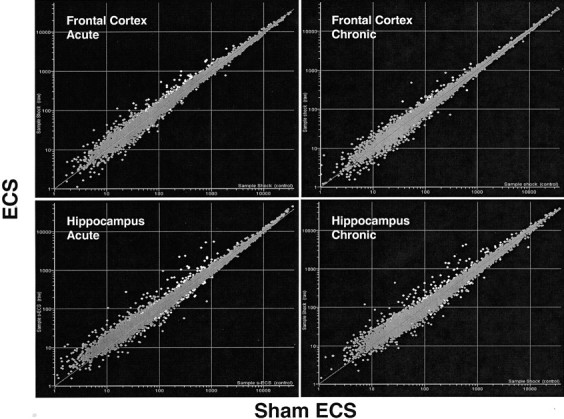
Plot of the mean abundances of each of the 8799 probe sets measured with the Affymetrix U34A rodent chip in the frontal cortex or hippocampus of rats that were exposed to either acute or chronic ECS (n = 10 per group; y axes) or sham control (n = 10 per group; x axes). Genes in white are those with ECS/control group ratios >1.5 or <0.67, with p <0.05, and passing minimum expression restrictions.