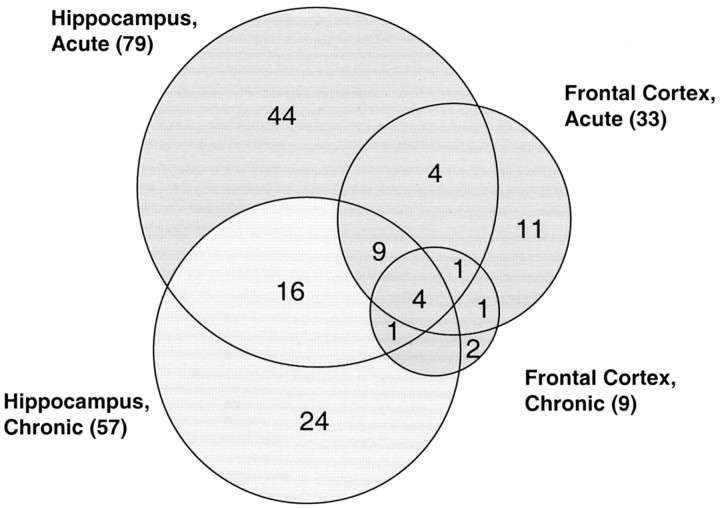
Figure 3.
Venn diagram representation of the distribution of changes (p < 0.05, ratio of change >1.5 or <0.67) in the 120 unique genes in the frontal cortex and hippocampus after acute or chronic ECS. Genes are represented only if the corresponding probe was detected as present in at least 50% of samples in one group, and mean abundance exceeded 100. The overlaps of three genes between hippocampus chronic and frontal cortex acute could not be illustrated and are included in the tally of genes for these two tissues (shown in parentheses).

