Figure 1.

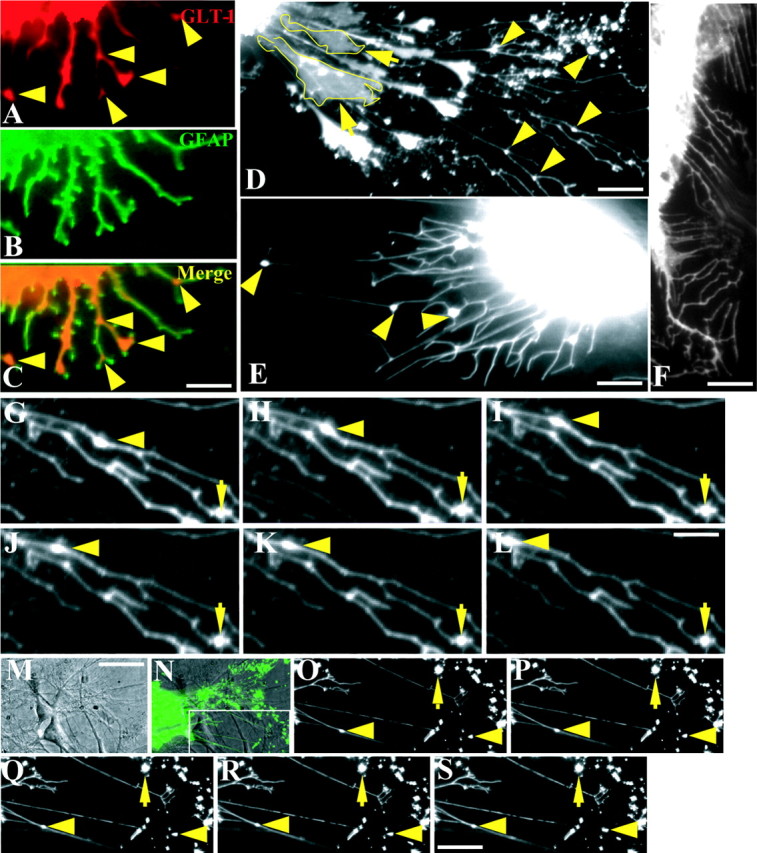
Mobility of GLT-1 clusters in the astrocytic process. Double immunostaining of GLT-1 (A) and GFAP (B) in astrocyte cultures showing clusters of endogenous GLT-1 in the fork or distal end of the process, as indicated by yellow arrowheads in A and the composite image (C), is indicated. Astrocytes (D) and C6 cells (E) transfected with the GFP-tagged GLT-1 expression cassette demonstrate GLT-1 cluster formation, as indicated by yellow arrowheads, whereas expression of GFP alone fails to form clusters (F). Please note that some long and thin processes in the astrocyte (D) are not generated directly from the cell body but instead from a filopodia-thick structure that is linked with the soma. This structure is outlined in yellow and referred to as a secondary process. Time-lapse imaging of live astrocytes reveals the mobility of GLT-1 clusters in astrocytic processes of both astrocyte cultures alone (G-L) and in cocultures with neurons (O-S). A differential interference contrast image (M) shows the neuron-astrocyte coculture in which the neuron grows on top of an astrocyte expressing GFP-tagged GLT-1. The inset (N) outlines the visualized portion of GLT-1 cluster mobility in the neuron-astrocyte coculture. A GLT-1 cluster on the process moves in a retrograde direction, as indicated by the arrowhead, although most of the clusters are stationary, as indicated by arrows. Scale bars: (in C) A-C, (in M) M, N, 15 μm; D, 10 μm; E, 7 μm; F, (in S) O-S, 9 μm; (in L) G-L, 3 μm.
