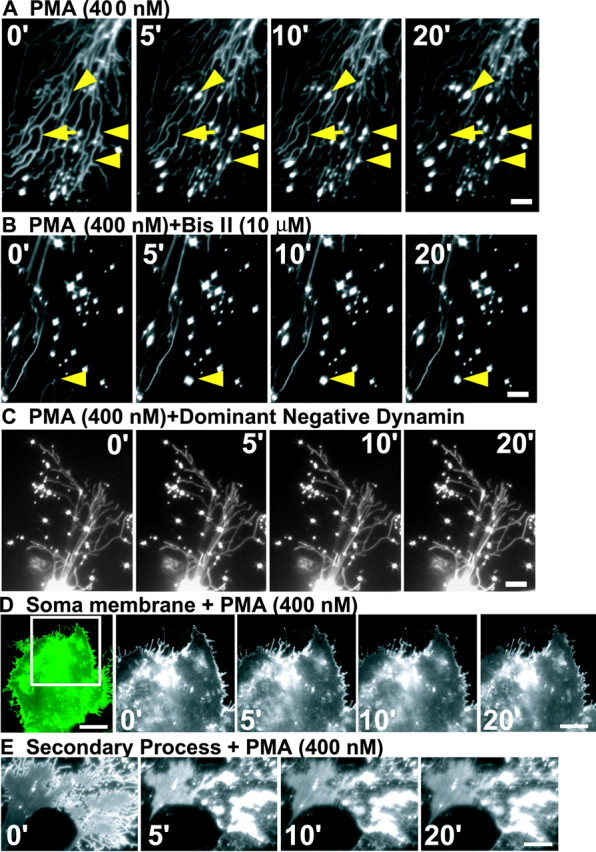
Figure 3.

PMA treatment preferentially reduces the level of GLT-1 protein in astrocytic process. Representative time-series pictures show changes in GLT-1 intensity and clusters in the astrocytic processes after treatments with 400 nm PMA (A), 400 nm PMA and 10 μm Bis II in combination (B), and 400 nm PMA on a dominant-negative dynamin-expressing astrocyte (C). The arrowheads in A and B outline the appearance of new clusters. D, Time-series pictures showing changes in GLT-1 intensity associated with the soma membrane after treatment with PMA (400 nm). The inset to the left outlines the visualized portion of the astrocyte. E, Time-series pictures showing changes in GLT-1 intensity after treatment with PMA (400 nm) on the astrocytic secondary process. Quantitations are based on five to nine independent experiments. The numbers in A-E represent time (in minutes). Scale bars: A, C, 5 μm; B, 10 μm; D, 25 μm (left image) and 15 μm (other 4 images); E, 8 μm.
