Figure 3.

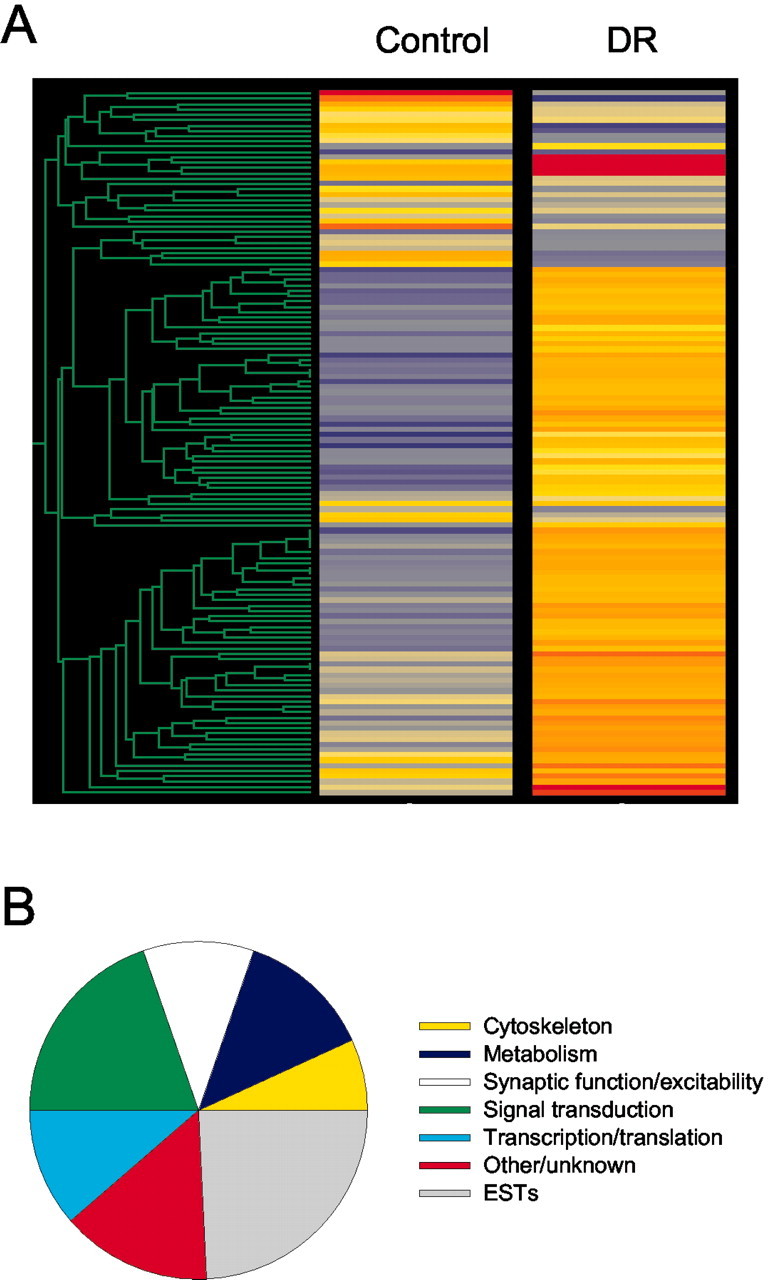
A, Hierarchical clusters showing the effect of dark rearing on the gene expression profile of mouse oculomotor nuclei. Values are based on average fluorescence intensity differences between the control and dark-reared groups (n = 3 microarrays per group). Changes in expression are color-coded: relative gene expression levels increase from blue to red; genes upregulated by dark rearing go deeper into yellow and red. B, Chart illustrating the proportion of genes for which the expression was altered by dark rearing in the respective functional categories. Assignment was based on information from public access gene ontology databases.
