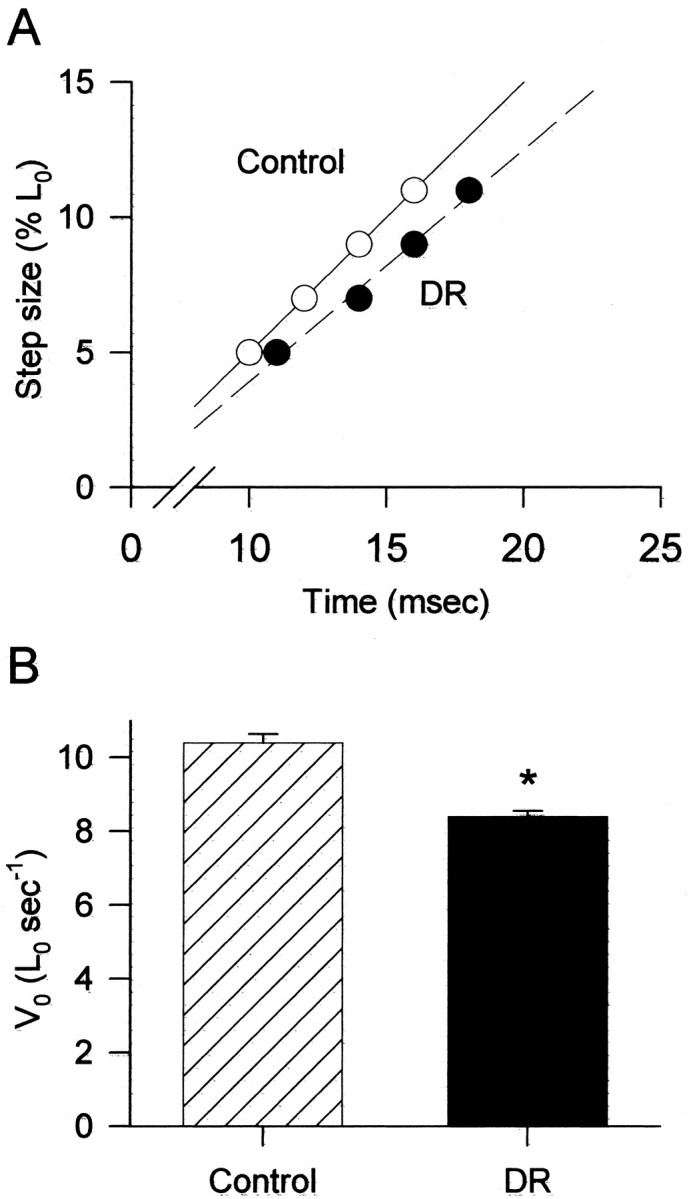
Figure 4.

A, Plot of the amplitude of the shortening step versus the time to take up the slack and redevelop force. Extraocular muscles from dark-reared mice (DR; black circles) had longer times than muscles from control animals (Control; white circles); therefore, the linear regression of the DR data points (dashed line) has a lower slope (slower V0) than the regression through the control points (solid line). B, Mean V0 is faster in extraocular muscles from control mice than in dark-reared (DR) mice; n = 10 muscles/group. *DR significantly different from control, p < 0.001.
