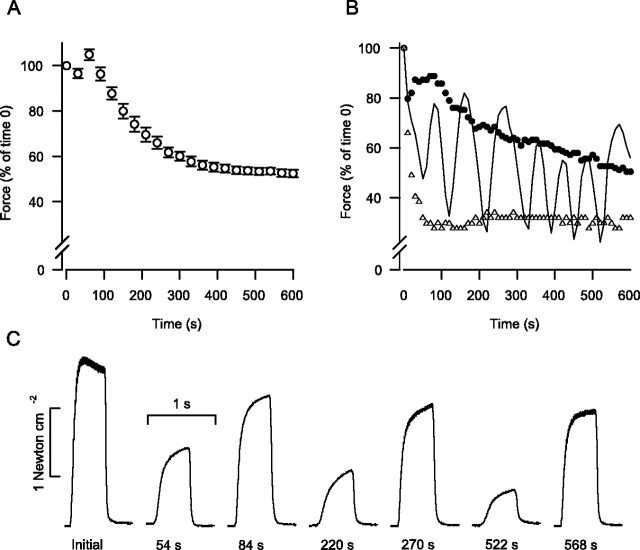
Figure 5.
A, Changes in force during fatigue for control extraocular muscles (n = 10). Data are mean force ± SEM determined every 30 sec for the duration of the fatigue protocol. B, Responses to fatigue of the extraocular muscles from dark-reared mice. Data are peak force of tetani measured every 10 sec. One pattern was similar to the typical response of control muscles (one muscle, black circles). Another pattern (two muscles, white triangles) was an early large force drop to a low plateau. The most common pattern (7 of 10 muscles) was fluctuations in force amplitude (seesaw). This pattern is exemplified by the black line showing the response of one muscle. C, Original records of tetani at selected time points during the fatigue protocol of an extraocular muscle from a dark-reared mouse. Tetani demonstrate the seesaw pattern of force amplitude seen in most extraocular muscles from this group.

