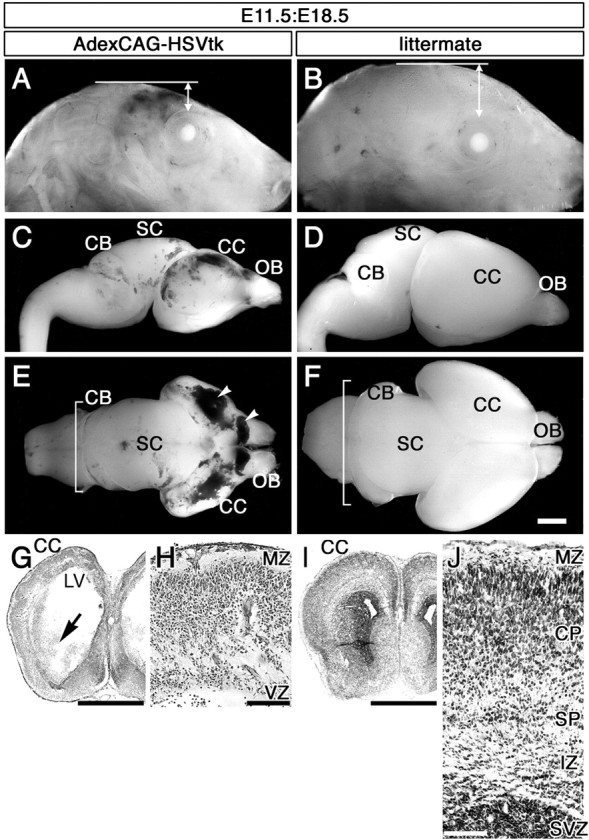
Figure 8.

Ablation of C-R cells and subplate neurons with AdexCAG-HSVtk and GCV. The left column shows the head (A, lateral view) and brain (C, lateral view; E, dorsal view) of E11.5:E18.5 mice injected with AdexCAG-HSVtk at E11.5 and treated with GCV. The right column shows the head (B, lateral view) and brain (D, lateral view; F, dorsal view) of a littermate that was not injected with AdexCAG-HSVtk but was treated with GCV as a control. Arrowheads in E indicate blood clots. Square brackets in E and F indicate the longitudinal size of the cerebellum (CB). A transverse section of the E11.5:E18.5 manipulated brain, which was stained with cresyl violet, is indicated in G and H. The arrow in G shows the destroyed SVZ of the striatum and CAU. LV, Lateral ventricle; MZ, marginal zone; OB, olfactory bulb; SC, superior coliculus; SP, subplate. Scale bars: (in F) A-G, 1 mm; H, 100 μm.
