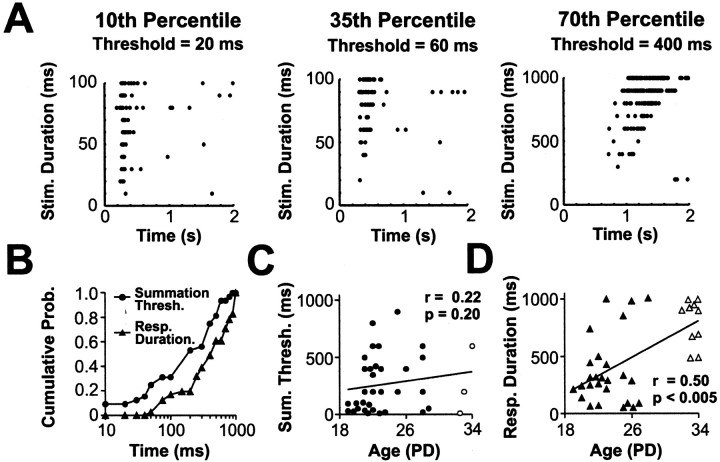
Figure 3.
Temporal properties of the earliest visual responses. dLGN cells were presented with whole-field flashed stimuli of different duration, and the summation threshold of a cell was defined as the shortest stimulus to evoke a statistically significant increase in spike rate compared with spontaneous activity (p < 0.05; Mann-Whitney U test). The response duration of a cell was calculated from responses to a 1000 msec stimulus and was defined as the period of time during which the activity of the cell remained above spontaneous levels. A, dLGN cells were ranked according to their summation threshold, and raster plots of the cells at the 10th, 35th, and 70th percentiles are shown. Each raster plot was constructed by combining the responses recorded from 10 presentations of each stimulus duration. Stated above each raster is the summation threshold for that cell. Note different scales on the y-axes. B, Cumulative probability plot of the summation threshold and response duration of dLGN cells recorded during the first 2 weeks of visual responsiveness. C, D, Scatter plots comparing age against the summation threshold (C) and response duration (D). Summation threshold did not correlate with age over this developmental period (Spearman r = 0.22; p = 0.20), whereas response duration correlated significantly with age (Spearman r = 0.50; p < 0.005). Other conventions are as shown in Figure 2.

