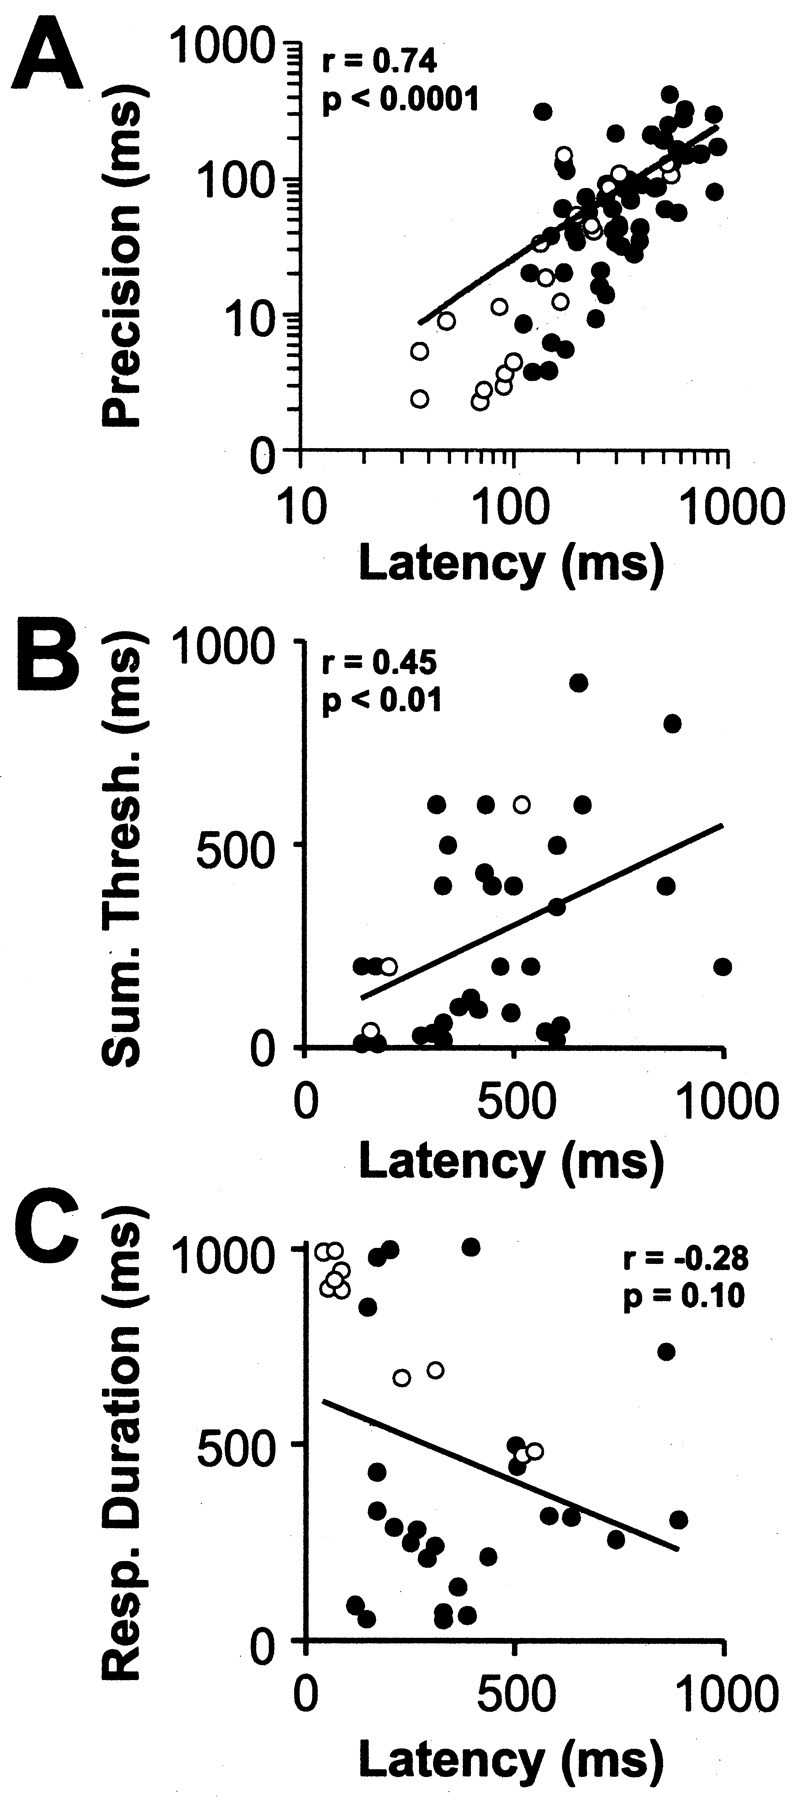
Figure 4.

Response latency predicts other temporal response properties of a developing cell. Scatter plots of response latency versus precision (A), summation threshold (B), and response duration (C) for dLGN cells recorded during the first 2 weeks of visual responsiveness. Cells recorded through the naturally closed eyelids are indicated with closed symbols, and those recorded just after eye opening are indicated with open symbols. The lines are unconstrained regression fits. The latency of a cell was found to be strongly positively correlated with both its precision (Spearman r = 0.74; p < 0.0001; n = 75) and its summation threshold (Spearman r = 0.45; p < 0.01; n = 35). Latency and response duration were not significantly correlated (Spearman r =-0.28; p = 0.10; n = 36).
