Figure 5.
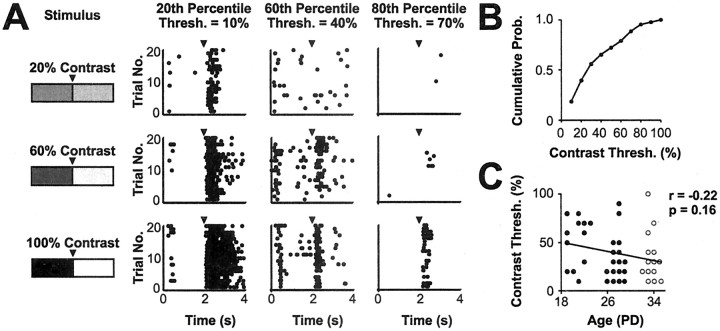
Contrast sensitivity of the earliest visual responses. Whole-field flashed stimuli were presented at a series of contrasts about a fixed mean luminance. The flashed contrast threshold was defined as the lowest contrast at which a neuron showed a significant increase in firing rate when compared with a blank screen at mean luminance (p < 0.05; Mann-Whitney U test). Stimuli were presented at a temporal frequency of 0.25 Hz. A, Neurons were ranked according to their contrast threshold, and raster plots for cells at the 20th, 60th, and 80th percentiles are presented (left to right) showing responses to 20, 60, and 100% contrasts (top to bottom). Each raster was constructed from a total of 20 cycles of the stimulus. B, Cumulative probability plot of the flashed contrast threshold of dLGN cells recorded during the first 2 weeks of visual responsiveness. The distribution reveals the range of thresholds displayed by cells during this period of development: the most sensitive cell responded to a contrast of just 10%, and the least sensitive to a contrast of 90%. C, Scatter plot showing that contrast threshold and age correlated negatively and weakly over this developmental period (Spearman r =-0.22; p = 0.16; n = 43). Other conventions are as shown in Figure 2.

