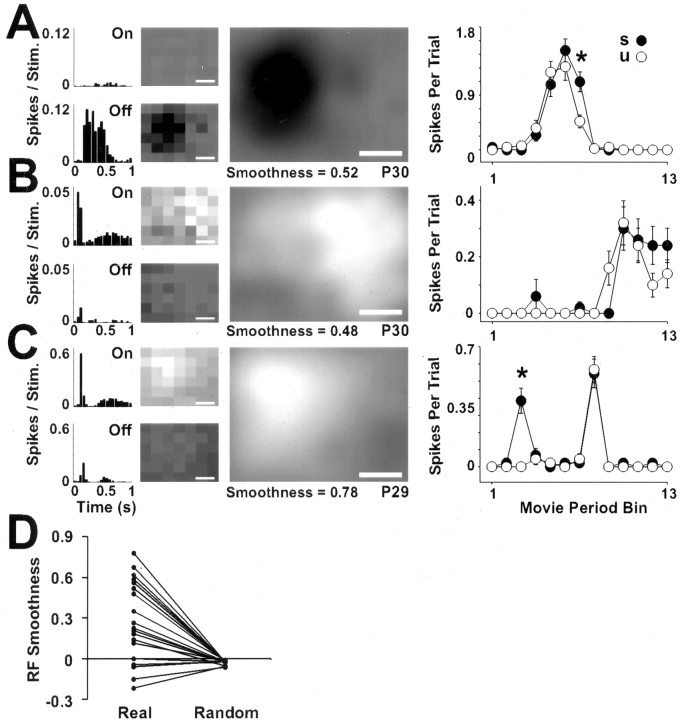
Figure 8.
Through-the-eyelid RFs account for spatial structure detection during natural visual stimulation. To record from as much of the RF as possible, the display monitor was moved for each cell. A-C, Data are shown for three dLGN cells in which RFs were mapped through unopened eyelids (P29-30). A series of plots are presented for each cell. From left to right these are PSTHs of the mean spike rate in response to white (On) and black (Off) flashed squares, raw RF profiles generated by reverse correlation (Jones and Palmer, 1987) from the spikes in the PSTHs, the combined (On minus Off) and smoothed RF map, and a line graph depicting the responses of the cell to structured and unstructured versions of a movie (same conventions as in Fig. 7). The age of recording and the RF smoothness are stated below each RF, and the scale bars represent 20° of visual space. The cells in A and B were recorded on the same electrode penetration, within 500 μm of one another. The cell in C was from a different animal. D, To quantify their spatial organization, we applied a measure of smoothness to the RFs and to randomized versions of the RFs (see Materials and Methods). Each line in the graph connects the real and random values for a single RF. According to this measure, 79% (15 of 19) of the real RFs were more organized than any of the randomized RFs.

