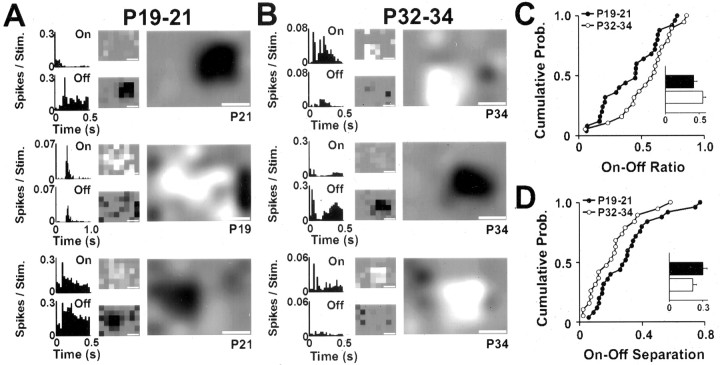
Figure 9.
On and Off activity during the period of early visual responsivity. A, RFs of three dLGN neurons recorded during the first few days of visual responsiveness (P19-21). The eyelids were opened for these experiments to collect data from as much of the RF as possible (without scattering attributable to the eyelid) and to allow comparison with RFs recorded at the time of eye opening. B, RFs of three dLGN neurons recorded 2 weeks later, just after natural eye opening (P32-34). C, D, Cumulative probability plots of On-Off Ratio (C) and On-Off separation (D) derived from the RFs of dLGN neurons in P19-21 and P32-34 animals. There was a tendency for older cells to be more dominated by either On or Off activity and to have On and Off maps that were more concentric, although neither value reached statistical significance at the 95% confidence level (p = 0.08 and p = 0.07; Mann-Whitney U test; On-Off ratio and On-Off separation, respectively). Insets show the mean values for the two age groups; all other conventions are as shown in Figure 8.

