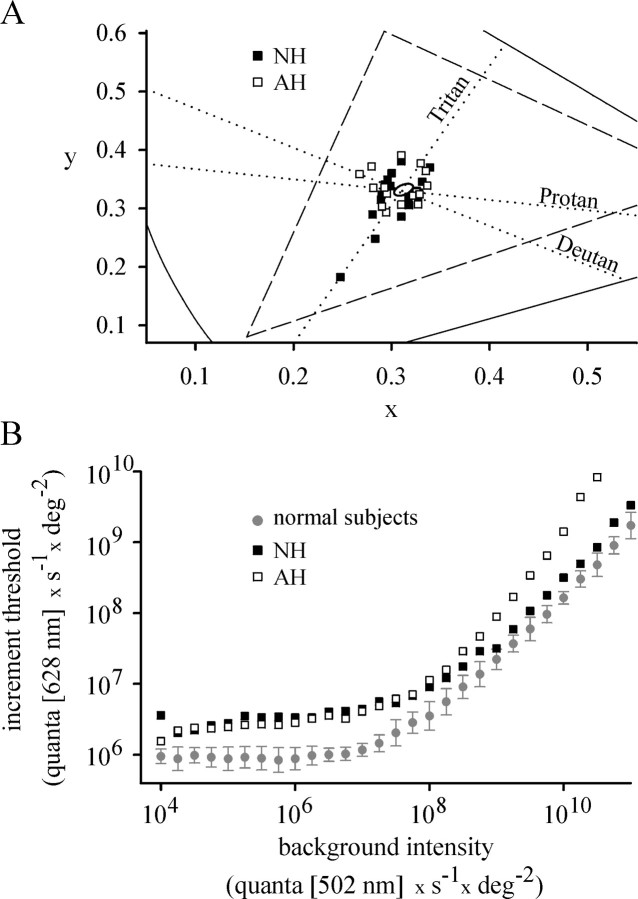
Figure 2.
Psychophysical analysis. A, Cone contrast thresholds plotted in the CIE 1931 chromaticity diagram. The continuous lines indicate the x and y chromaticity coordinates of saturated colors; the triangle (dashed line) includes all colors that can be displayed on the RGB color monitor. The dotted lines labeled Protan, Deutan, and Tritan refer to the cone excitation axes of the L, M, and S cones, respectively. They intersect at the point of neutral background chromaticity. Average cone contrast thresholds, measured for the right eye, are shown for subjects NH (filled squares) and AH (open squares). Similar results were obtained for the respective left eyes. Cone contrast thresholds of four normal subjects (measured for the right eye) were fitted by the ellipse (centered near the intersecting axes) using a least squares fit algorithm. B, Cone TVI functions. Incremental thresholds for a 628 nm target, flashed once every 1 sec for 50 msec, were measured as a function of the quantal flux density of a 502 nm background. The thresholds of NH (filled squares), AH (open squares), and four normal subjects (filled circles, representing mean ± SD) were measured in the respective right eyes.

