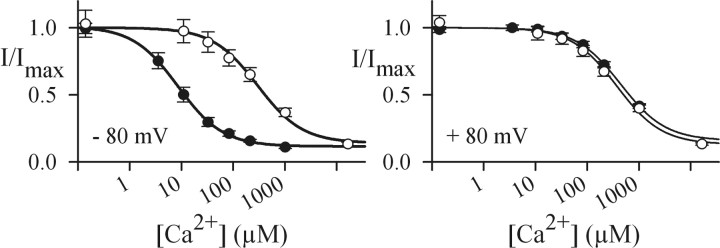
Figure 5.
Blockage by extracellular Ca2+ of A3 and A3T369S channels. Dose-response relations at -80 mV (left) and +80 mV (right) for the blockage of monovalent current by extracellular Ca2+ ions for A3 (filled circles) and A3T369S (open circles) channels are shown. Solid lines were calculated with the equation I/Imax = (1 - a) Ki/(Ki + c) + a, where c is Ca2+ concentration; Ki, concentration of half-maximal inhibition; and a, residual current nonsusceptible to blocking, using the following Ki values: 387.9 ± 36.0 μm (+80 mV) and 9.9 ± 1.4 μm (-80 mV) (A3; N = 6); and 381.4 ± 85.4 μm (+80 mV) and 289.5 ± 59.1 μm (-80 mV) (A3T369S; N = 5).

