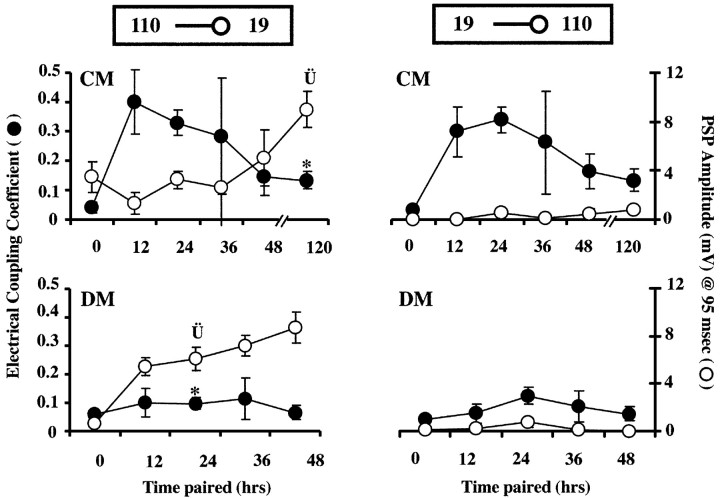
Figure 6.
Time course of electrical and chemical synaptogenesis in 19-110 soma-soma pairs in culture. Both y-axis labels apply to all four graphs. Current was injected into either presynaptic neuron 110 (left graphs) or presynaptic neuron 19 (right graphs) while membrane potential was simultaneously recorded in both neurons. Left, top, Time course of synapse formation in CM. At 12 and 24 hr, in the presence of strong, trophic factor-induced electrical coupling, PSP amplitudes were at their lowest. By 120 hr, when ECC values were lower (*p < 0.0005), PSP amplitudes were significantly elevated above 24 hr levels ( p < 0.002). Left, bottom, Time course of synapse formation in DM. In the absence of trophic factors, electrical coupling never developed strongly, and ECC values were significantly lower than those in CM at 24 hr (*p < 0.0001). At this same time point, significantly higher PSP amplitudes were seen in DM than in CM (
 p < 0.05). By 48 hr of contact in DM, ECC values were still low, but PSP amplitudes (8.7 ± 1.3 mV) had increased to values similar to those seen after 5d of culture in CM (CM at 120 hr: 9.0 ± 1.5 mV). Right, top and bottom, Time course of electrical and chemical synapse formation with current injection into neuron 19. ECCs were similar to 110 current injections with strong transient coupling in CM, but not DM. Thus, electrical synaptic connections were non-rectifying in both DM and CM pairs (right vs left graphs of ECC values). PSPs in neuron 110 at 95 msec from AP peak were virtually undetectable in response to stimulation of neuron 19 in both DM and CM. (n: DM, 0 hr = 16, 12 hr = 4, 24 hr = 16, 36 hr = 9, 48 hr = 7; CM, 0 hr = 15, 12 hr = 6, 24 hr = 32, 36 hr = 9, 48 hr = 6, 120 hr = 19.)

