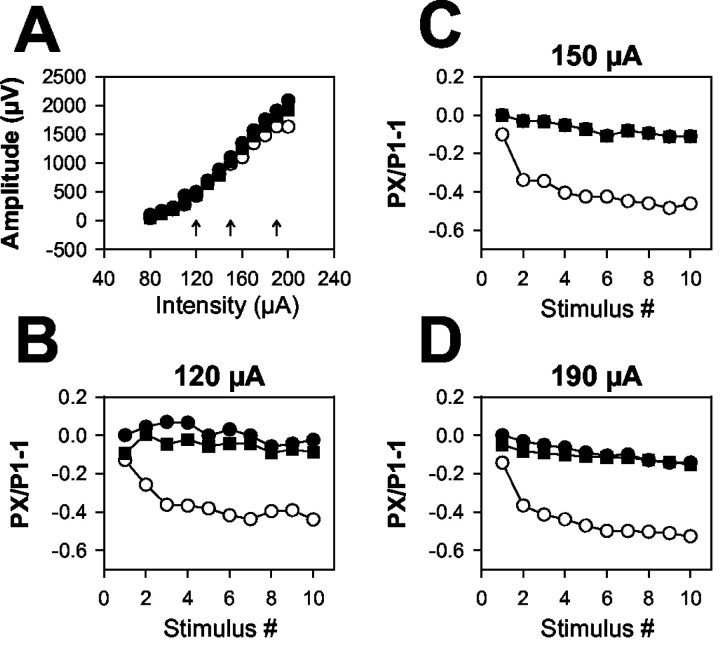
Figure 7.
[K+]o-induced afferent volley depression is independent of stimulus intensity. A, Afferent volley stimulation input/output curve for conditioning pulses in a representative slice. Stimulus intensity was varied, whereas stimulus duration remained constant at 50 μsec. B-D, Modulation of afferent volley peak amplitudes during a 10 pulse, 50 Hz train at the indicated stimulus intensities (denoted by arrows in A). Responses during baseline and washout 2.5 mm [K+]o are indicated by filled circles and filled squares, respectively. Responses to 8 mm [K+]o are indicated by open circles. Frequency-dependent depression in 8 mm [K+]o remained quantitatively similar at all stimulus intensities. Similar effects were seen in three slices. NBQX (1 μm) was included in the bath to eliminate postsynaptic receptor activation.

