
Figure 5.
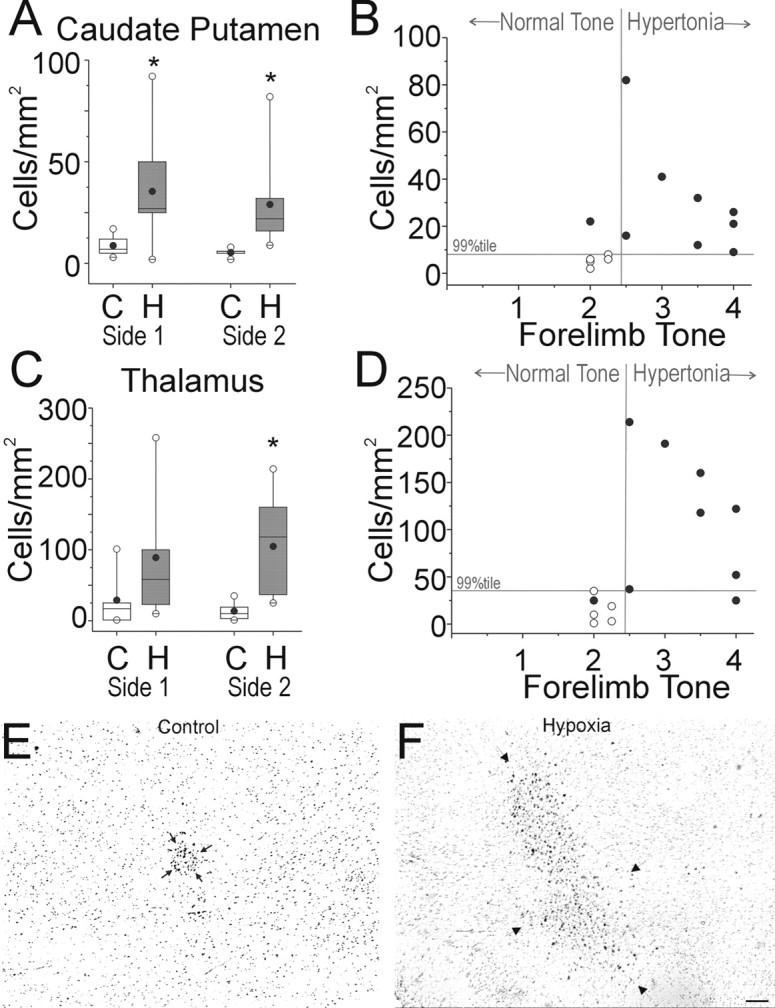
Blinded histopathological analysis reveals delayed injury to the caudate putamen and thalamus. Brain tissue sections obtained at P1 from control (C) and hypoxic survivors of 40 min hypoxia at E22 (H) were stained for HAM 56 antibody. Automated cell counts of HAM 56-labeled cells are shown as cell density (cells/mm2) and were done as described in Materials and Methods. Side 1 and Side 2 refer to the counts obtained from each half of the brain, where the side was randomly assigned. A, Density of HAM 56-labeled cells in the caudate putamen. Data are shown as a box and whisker plot. Black circles, Mean; white circles, 99th percentile. *p < 0.05; Wilcoxon signed rank test compared with controls. B, The association between the number of activated microglia and hypertonia is shown for the caudate putamen. Abscissa is tone with cutoff at 2.5 for defining hypertonia. Any point to the right of the vertical gray line represents a case of hypertonia. Ordinate represents cell density. A cutoff at the 99th percentile for the control population is depicted as a horizontal gray line, and any point above this line represents a cell density that is higher than the 99th percentile of controls. The 2 × 2 association tested with Fisher's exact test is significant (p < 0.05). C, The density of HAM 56-labeled cells in the thalamus. Data are shown as a box and whisker plot. Black circles, Mean; white circles, 99th percentile. *p < 0.05; Wilcoxon signed rank test compared with controls. D is similar to B and shows the association between the number of activated microglia in the ventral thalamus and hypertonia as described in the text. The abscissa and ordinate are as in B. The 2 × 2 association tested with Fisher's exact test is significant (p < 0.05). E and F show representative images from the ventral thalamic nuclei of animals from the control and hypoxia groups, respectively. Arrows delineate the collections of HAM 56-labeled cells. Scale bars, E, F, 100 μm.