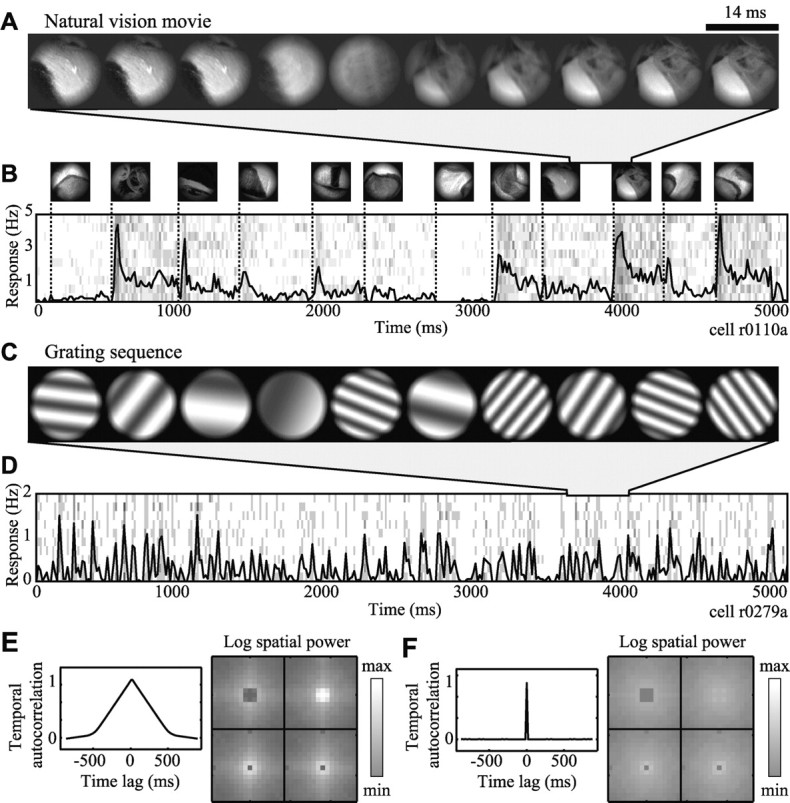
Figure 1.

Natural and synthetic stimuli. A, Natural vision movies mimic the pattern of stimulation in a parafoveal receptive field during free viewing of a static, monochromatic natural scene. The stimulus remains constant during simulated fixations and changes rapidly during simulated saccades (compare frames 2, 3 with 5, 6). B, Five seconds of the same movie are shown schematically in the top row. The pattern appearing during each simulated fixation appears once, aligned on the left edge to the time of fixation onset. Below is the PSTH averaged over 10 repeated movie presentations. After the onset of each new fixation (dotted lines) the neuron responded with a brief burst of activity, followed by a weaker sustained response. C, Several frames from a grating sequence. The sine wave grating shown in each 14 msec frame varies randomly in orientation, spatial frequency, and spatial phase. D, The plot shows the PSTH averaged over 10 repeated presentations of a 5 sec grating sequence. E, Temporal and spatial statistics of a natural vision movie. Temporal autocorrelation (left) decreases linearly to zero at lags of ∼500 msec because of the temporal dynamics of simulated saccades. The log spatial power spectrum (right) is plotted in the phase-separated Fourier domain, where each subpanel refers to a different spatial phase (for details, see Materials and Methods, Fig. 2). Power decreases linearly from low frequencies at the center of each subpanel, reflecting the 1/f2 power spectrum of natural images. F, Temporal and spatial statistics of a grating sequence, plotted in the same manner as E. There is no temporal autocorrelation at nonzero time lags because the grating pattern changes randomly in each frame. Log spatial power is nearly uniform, reflecting the sampling of grating parameters.
