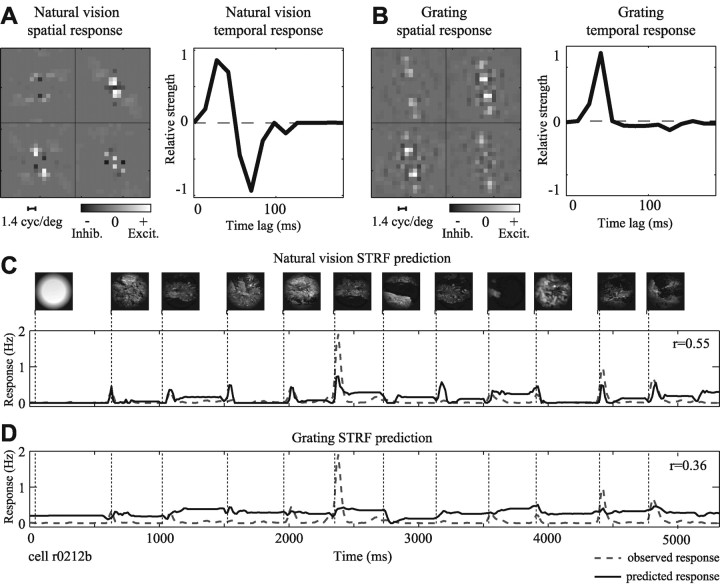
Figure 3.
Natural stimulus statistics influence temporal response properties. A, STRF estimated using natural vision movie. Axes are as in Figure 2 D. The spatial response function, left, is tuned to stimuli just counterclockwise of horizontal, with peak spatial frequency tuning of 1.1 cycle/°. The temporal response function shows a peak latency of 35 msec followed by a negative, inhibitory component at greater time lags (63-91 msec). B, The STRF estimated using a grating sequence shows some differences in tuning. The spatial response function is similar to that in A, although with slightly higher excitatory spatial frequency tuning (peak, 1.4 cycle/°). However, the temporal response is quite different, with a peak latency of 49 msec and no late inhibitory component. C, STRFs were compared by measuring their ability to predict natural vision movie validation data. The prediction by the natural vision movie STRF (solid line) is overlaid on the observed PSTH (dashed line). This neuron gave a highly transient response during each fixation epoch in the natural vision movie. The predicted PSTH matches these transients well, with a correlation of r = 0.55. D, The grating sequence STRF fails to predict the transient responses and has a significantly lower prediction correlation (r = 0.36; p < 0.05, randomized paired t test). Inhib., Inhibition; Excit., excitation.

