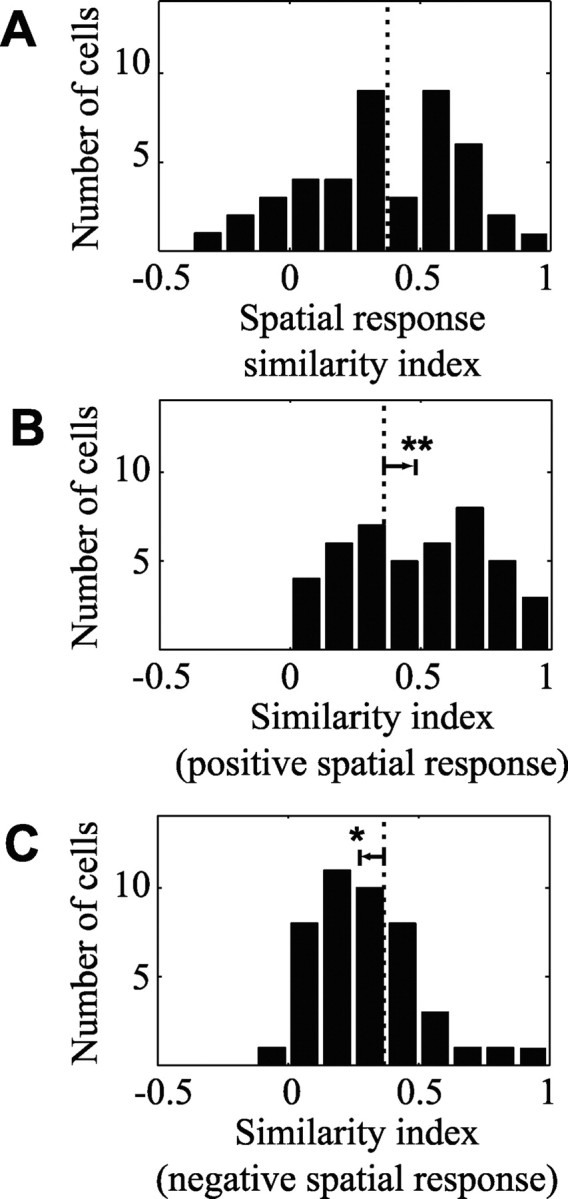
Figure 8.

Natural stimuli affect spatially tuned inhibition. A, Histogram of similarity index values (Eq. 16) between spatial response functions estimated using natural vision movies and grating sequences. The distribution of index values has a mean of 0.37 (dotted line; n = 44). B, Histogram of similarity index values between only the positive coefficients of the same spatial response functions. The distribution is shifted significantly toward higher values relative to A (arrow), with a mean of 0.49 (p < 0.001, randomized paired t test). C, In contrast, the histogram of spatial similarity between the negative coefficients reveals a significantly lower mean of 0.30 (p < 0.05, randomized paired t test), suggesting that the greater difference between spatial response functions lies in inhibitory tuning.
