
Figure 7.
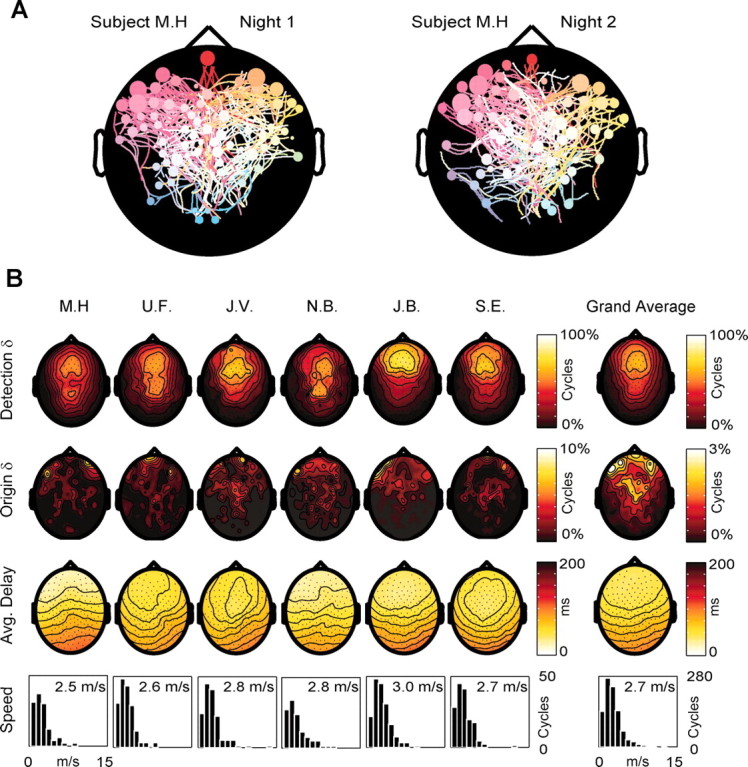
The general pattern of origin and propagation of sleep slow oscillations is reproducible across nights and across subjects. In A, the origins and patterns of propagation of the slow oscillation cycles recorded from the same subject during two different nights are represented by two streamline maps. Note the similarity of the two maps in terms of both origin density (higher at left frontal electrodes) and pattern of propagation. B summarizes the results obtained from all six subjects during one night. The first row contains the detection density maps showing the probability of each electrode detecting the slow oscillation. In all subjects, the highest density was over the frontal lobe. In two subjects (U.F. and N.B.), a secondary high-density spot was detected on more posterior scalp regions. The grand average of the detection densities is shown on the left. The second row contains the origin density maps. Note that in all subjects the density of origins is higher in frontal regions. As shown in the grand average on the left, the clusters of electrodes with the highest origin density are located on the most anterior scalp regions, overlying the orbitofrontal cortex. The third row contains the average delay maps. In all subjects the prevalent direction of propagation is anteroposterior. Note that, on the average, channels located at homotopic scalp sites tend to have a similar delay. The fourth row illustrates the distribution of the propagation speeds and the average speed calculated for all the cycles traveling on the anteroposterior axis in each subject. Note that the average speed of the slow oscillation is similar in all subjects (∼2.7 m/sec).