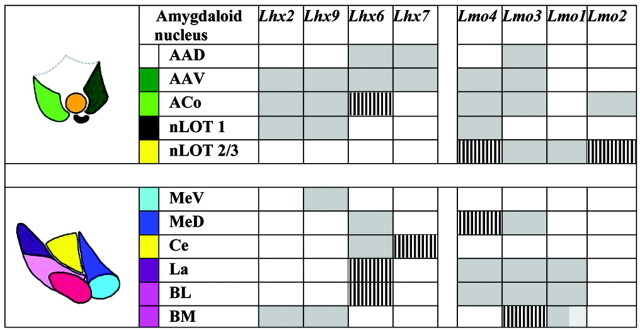
Figure 2.
Combinatorial expression of LIM genes identifies distinct nuclei in the embryonic amygdaloid complex. a-h are sections of E17.5 brain, cut at Level 1 in the schematic. Lmo1-Lmo4 are expressed in the nLOT 2/3 (a, b, g, h, dotted circle). This structure is excluded by Lhx2, Lhx7, and Lhx9 expression, whereas Lhx6 is expressed in a few scattered cells (c-f, dotted circle). The nLOT1 expresses Lhx2, Lhx9, and Lmo4 (c, f, h, arrowhead). The ACo expresses all, except Lmo1 and Lhx7 (a-d, f, h, open arrowhead). The AAV expresses Lhx2, Lhx6, Lhx7, Lhx9, Lmo3, and Lmo4 (a, c-f, h, filled arrow), whereas the AAD expresses only Lhx6, Lhx7, and Lmo3 (a, d, e, open arrow). i-n are sections cut at Level 2 in the schematic. Lmo1, Lmo3, Lmo4, and Lhx6 are expressed in the La (i, j, k, n, filled arrowhead) and in the BL (i, j, k, n, open arrowhead). The BM expresses Lmo1 and Lmo3 in a gradient, Lhx9 throughout, and is excluded by Lmo4, Lhx6, and Lhx7 (i, j, k, m, n, dotted oval). The MeV expresses Lhx9 (m, open arrow), and the MeD expresses Lmo3 and Lhx6 (k, n, filled arrow). The Ce displays Lhx6 and Lhx7 expression but has greatly reduced expression of the other markers (i-l, n, asterisk, dashed lines). Scale bar, 200 μm.

