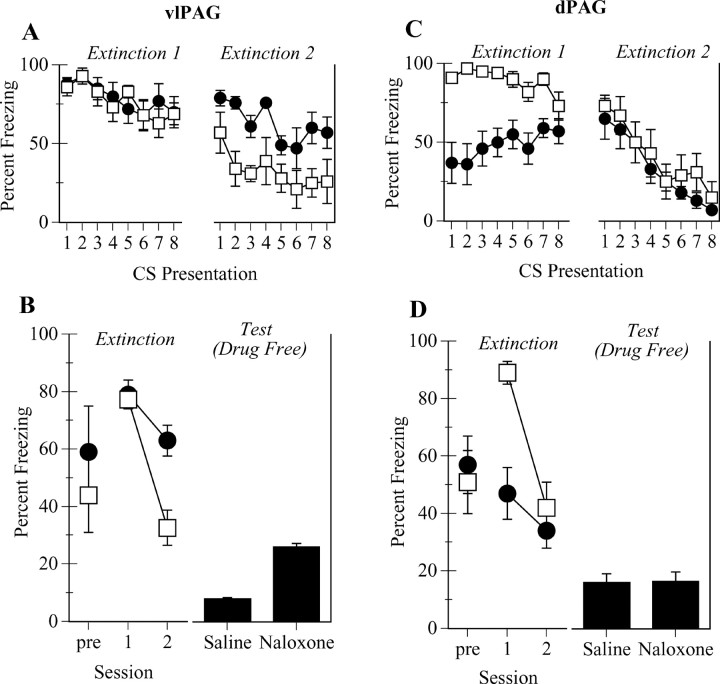
Figure 3.
Role of opioid receptors in vlPAG (experiment 2) and dPAG (experiment 3) in extinction of conditioned freezing. A, Mean ± SEM percentage of freezing per 2 min CS presentation across the 2 d of extinction (open squares, saline; filled circles, naloxone). B, Mean ± SEM percentage of freezing during the first 4 min before CS onset and average freezing across extinction training for the groups described in A, as well as freezing during a drug-free test (experiment 2). C, Mean ± SEM percentage of freezing per 2 min CS presentation across the 2 d of extinction (open squares, saline; filled circles, naloxone; experiment 3). D, Mean ± SEM percentage of freezing during the first 4 min before CS onset and average freezing across extinction training for the groups described in C (open squares, saline; filled circles, naloxone), as well as freezing during a drug-free test (experiment 3).

