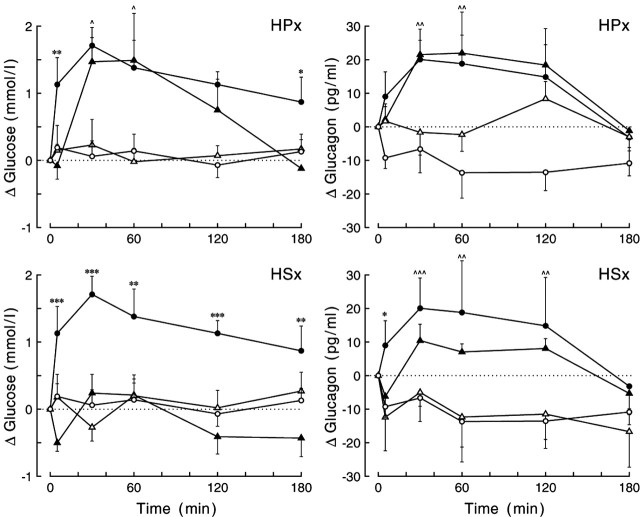
Figure 7.
Changes in plasma glucose (left panels) and plasma glucagon (right panels) concentrations during the 2 hr administration of BIC in the PVN of liver-intact and liver-denervated animals. Data from the HPx and HSx liver-denervated animals are displayed in the top and bottom rows, respectively. In both intact and liver-denervated animals, all BIC-induced glucose and glucagon responses were significantly increased compared with the respective control experiments (p < 0.03 for all day × sampling interactions), except for the glucose response in HSx animals (bottom left). Moreover, only the glucose response in the HSx group differed significantly from that in liver-intact animals (p < 0.001 and p = 0.016 for group and group × sampling effects, respectively). In neither of the two liver-denervated groups did the glucagon response differ from that in liver-intact animals (p > 0.5 for both group and group × sampling effects). For basal t = 0 concentrations and additional statistics, see supplemental Tables 5 and 6 (available at www.jneurosci.org as supplemental material), respectively. Closed symbols indicate the effect of BIC, and open symbols show the results of the respective control experiments. Circles, Liver-intact animals; triangles, liver-denervated animals. *,^p < 0.1, **,^^p < 0.05, and ***,^^^p < 0.01, respectively. ^ and * indicate the results of paired (i.e., experimental day vs control day) Student's t tests in the liver-denervated animals and unpaired (i.e., liver-intact animals vs denervated animals on experimental days) Student's t tests, respectively.

