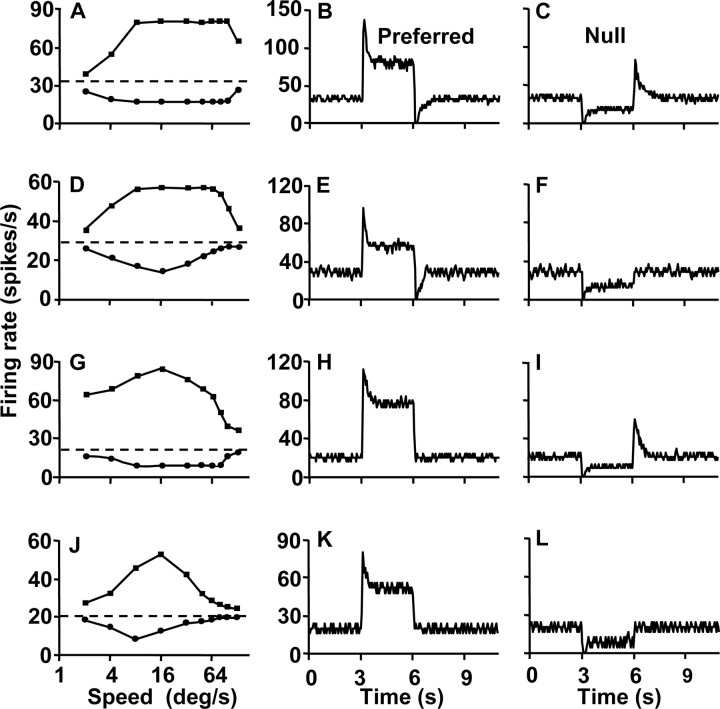
Figure 1.
Speed-tuning curves and transient responses of motion-sensitive neurons in the pigeon nucleus lentiformis mesencephali. Three acceleration-sensitive neurons and one speed-sensitive neuron are shown in the four rows of graphs that demonstrate responses of a pn-cell, p-cell, n-cell, and ss-cell from top to bottom. A, D, G, J, Speed-tuning curves derived by plotting mean response as a function of speed for stimulus motion at constant speed. The horizontal dashed line shows the baseline firing rate at zero speed, and the connected sets of points above and below the dashed line show response to target motion in the preferred and nonpreferred (null) directions. B, E, H, K, Transient responses to the onset and offset of a step of stimulus speed in the preferred direction. C, F, I, L, Transient responses to the onset and offset of a step of stimulus speed in the nonpreferred direction. The stimulus motion began and ended at 3 and 6 sec on the x-axis. Firing rate curves were obtained by averaging five repeats of each stimulus with a bin width of 50 msec.

