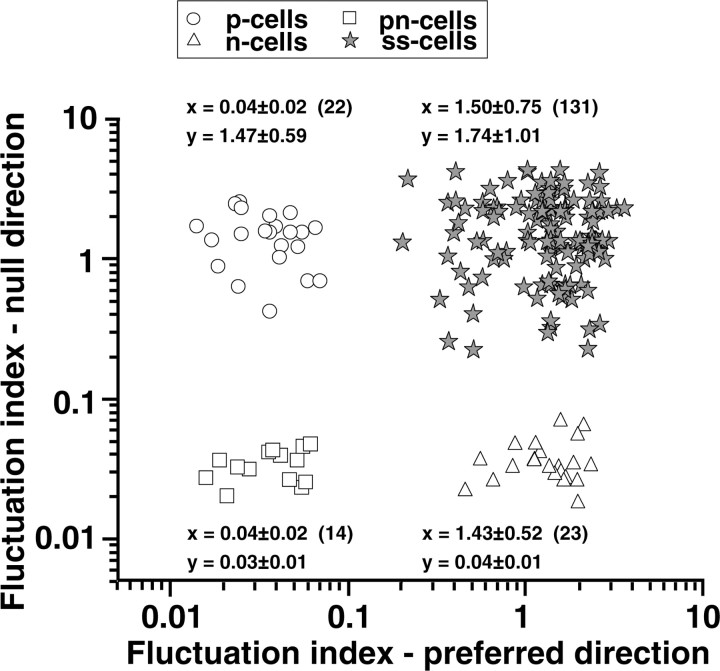
Figure 2.
Scatter plot showing classification of 190 pretectal neurons into four distinct groups based on the shape of speed-tuning curves. Each point summarizes the speed-tuning curves of an individual neuron and plots the fluctuation index for motion in the null direction as a function of that for motion in the preferred direction (x-axis). Fluctuation index values given above or below each cluster of points are mean ± SD; numerals in parentheses are the number of neurons examined.

