Figure 3.
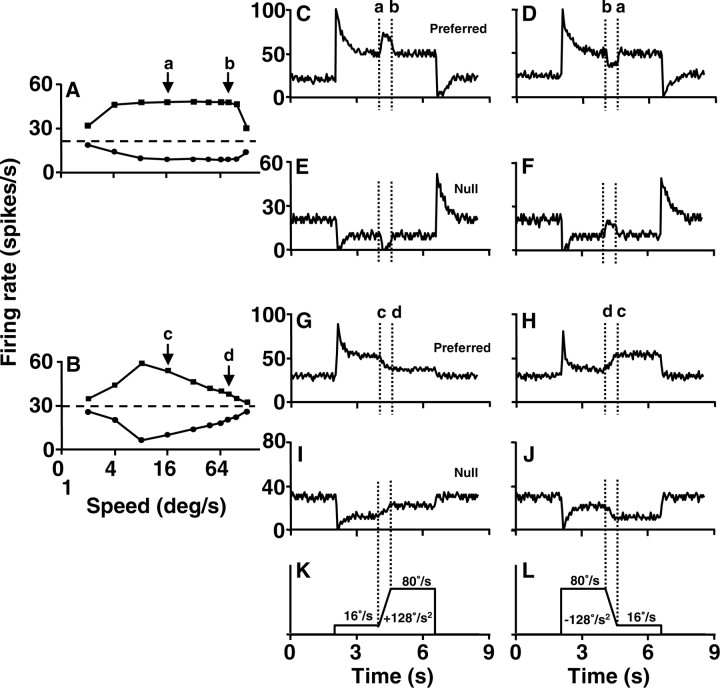
Examples of responses to stimulus acceleration for two pretectal neurons. A, B, Speed-tuning curves like those in the first column of Figure 1, for a pn-cell (A) and an ss-cell (B). C-F, Responses to stimulus acceleration for the pn-cell shown in A. G-J, Responses to stimulus acceleration for the ss-cell shown in B. For each cell, the first and second rows of the firing rate traces show the responses to stimulus motion in the preferred and nonpreferred direction. The first and second columns show responses to smooth target accelerations that caused increases and decreases in the firing rates in the cell in A but not in the cell in B. The changes in the firing rates induced by acceleration or deceleration in G-J are actually attributable to changes in speed along the bell-shaped speed-tuning curves (see Fig. 4). K, L, Trajectories of stimulus speed for the two columns of firing rate traces. The vertical dotted lines in C-L bracket the duration of stimulus acceleration and deceleration. Letters a, b, c, and d with arrows indicate the range and direction of changes in speed along the speed-tuning curves. Each firing rate trace was obtained by averaging nine repeats of a given stimulus with a bin width of 50 msec.

