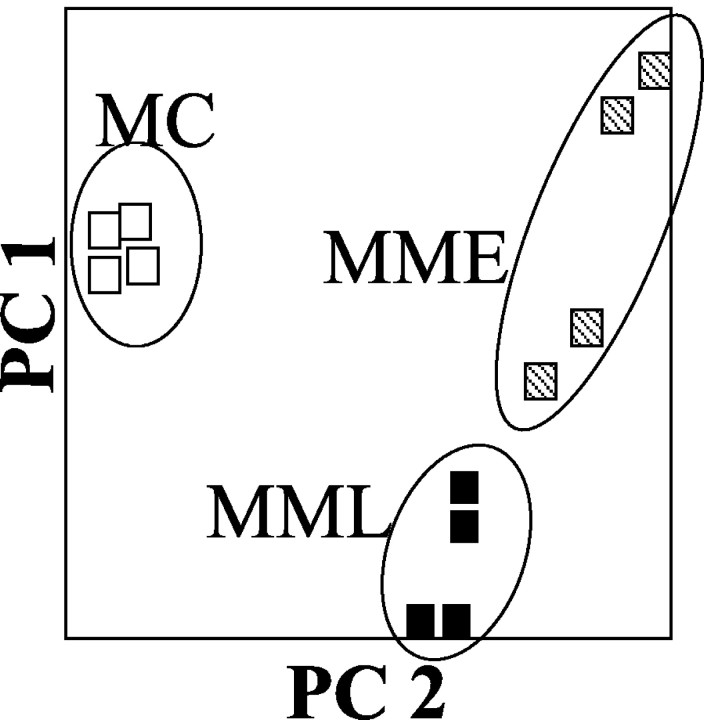
Figure 6.
PCA of MPTP-treated samples. PCA of the Affymetrix GeneChip data indicates that each treatment group's samples occupy nonoverlapping areas in the two-dimensional space defined by PC1 and PC2. The samples can also be seen to fall into two different pairings: one in which the controls and MPTP late samples (▪) share the bottom left area and the MPTP early samples (▧) are alone in the top right area, and another in which the controls (□) are alone in the far left area, whereas the two MPTP groups occupy the right side of the space. These are precisely the two different pairings seen in hierarchical clustering.

