
Figure 2.
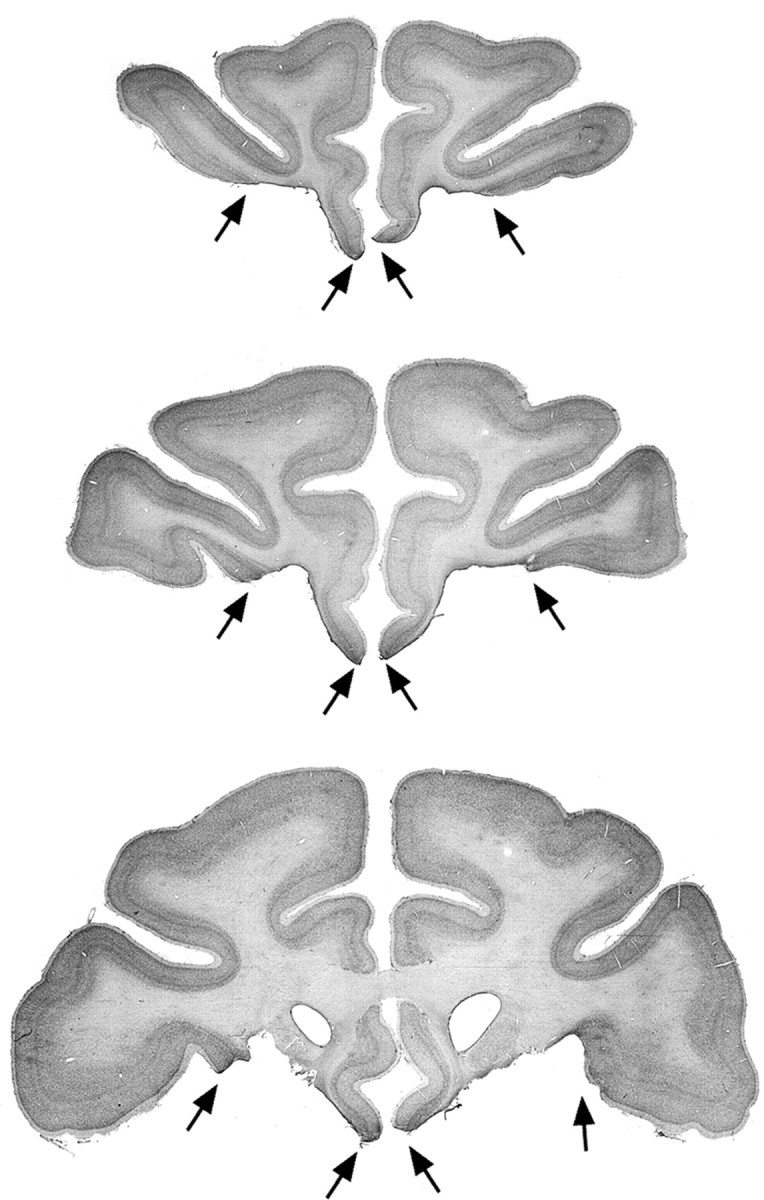
Photomicrographs of Nissl-stained coronal sections through the lesion in PFo-3. The black arrows mark the boundaries of the bilateral PFo lesion. Top to bottom, The levels shown are approximately +36, +32, and +28 mm anterior to the interaural plane (0). Compare and contrast with Figure 1.