
Figure 4.
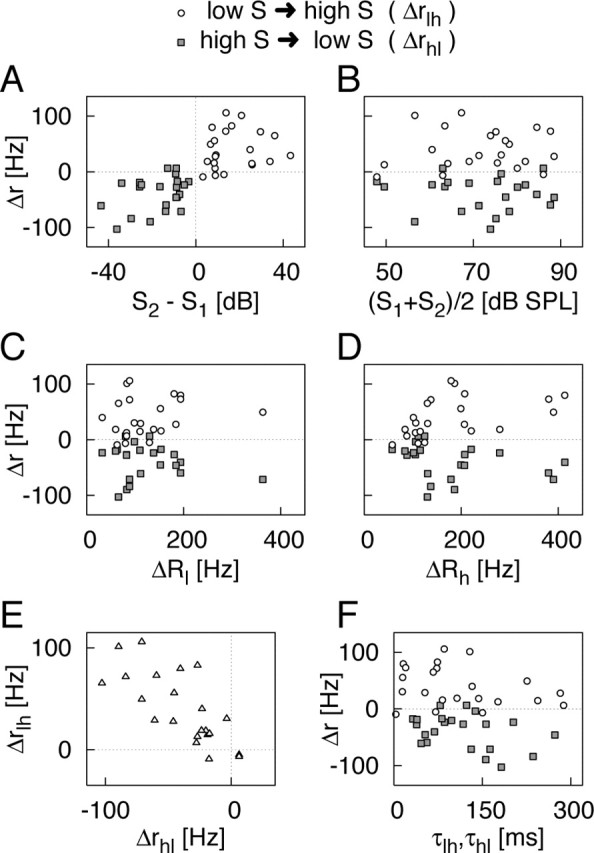
Correlation analyses of the parameters obtained from the firing-rate deflections. The initial firing-rate difference, Δr, and the decay time constant, τ, are obtained from exponential fits of the firing-rate transients after the stimulus switch. To distinguish between the two directions of the switch, the parameters are labeled Δrlh, τlh for switches from lower to higher intensity, and Δrhl, τhl for switches from higher to lower intensity, and the data are plotted as open circles and filled squares, respectively. The open triangles in E depict the comparison between Δτlh and Δτhl. A-F, The panels display the relationships between Δr,τ, the sound intensities S1 and S2, and the total level of adaptation after stimulus onset, ΔRl for the lower intensity and ΔRh for the higher intensity.