Figure 2.
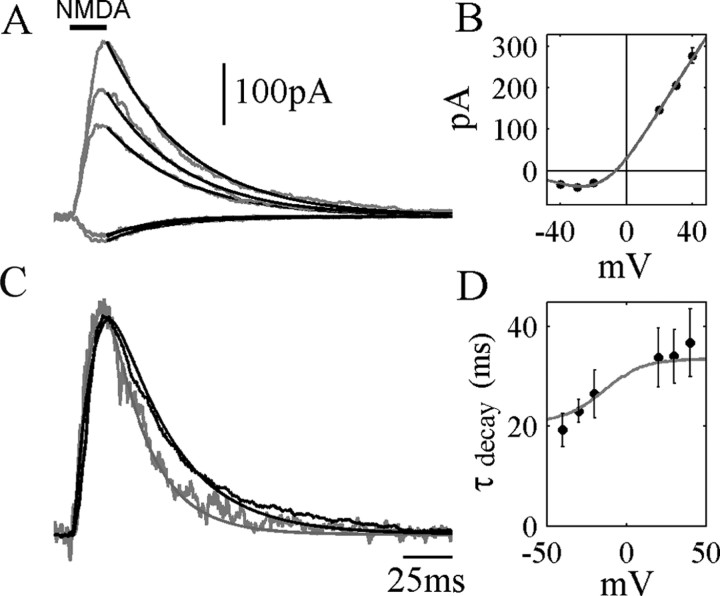
Voltage dependence of deactivation. A, Single exponential fits to the decay phase of NMDA receptor currents in response to a 20 msec exposure to 500 μm NMDA. Holding potentials (from top to bottom): +40, +30, +20, -20, -40 mV. B, Current-voltage plot of peak NMDAR currents, fitted to a Boltzmann distribution for Mg2+ block. C, Currents at -40 and +40 mV in A, normalized to peak amplitude to allow comparison of time course. Smooth superimposed curves are the predictions of the ATB model (see as follows) with the following parameters: α′ = 270, β′ = 46, kr = 1.8, kd = kd′= 8.4 (sec-1), kon = 2000 mm-1sec-1, koff = 32.8 sec-1. Agonist concentration time course was a Gaussian-filtered step with a 10-90% rise time of 3 msec. D, Circles represent the average (±SD) of single exponential fits to NMDAR current decay (500 μm NMDA, 20 msec perfusion, 5 nucleated patches), showing an increase in the decay time constant with membrane potential. Superimposed curve shows the time constant of single exponential fits to deactivation time course for the ATB model.

