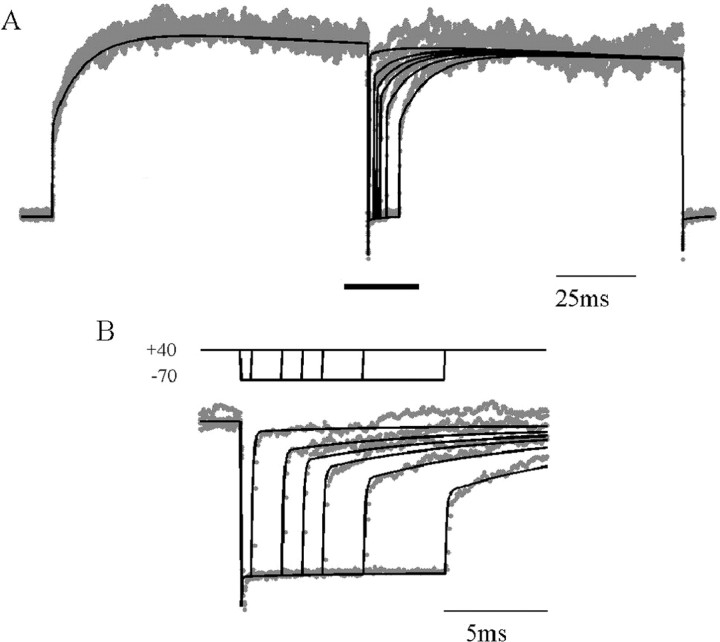
Figure 9.
Fit of ATB model to recovery of slow-unblocking fraction. A, Current responses recorded as in Figure 8. Superimposed black traces show fit to ATB model with α′ = 214 sec-1, β′ = 40 sec-1, kd = 5 sec-1, kd′ = 5 sec-1, kon = 5000 mm-1sec-1, koff = 82 sec-1. B, Expanded time scale view for the segment indicated by the thick bar in A.

